To say that Trump’s trade tussle against China is hurting the stock market would be a gross understatement, as the president's inflammatory rhetoric has clobbered the Dow Jones Industrial Average. | Source: Johannes EISELE / AFP
Share
By CCN.com: To say that Trump’s trade tussle against China is hurting the stock market would be a gross understatement, as the president’s inflammatory rhetoric has clobbered the Dow Jones Industrial Average.
However, investors should not only be concerned about the number of points the stock market lost in the last couple of weeks, as the timing of this development is equally as crucial.
These 9 Dow Stocks Will Crash if Trump’s Trade Deal Bombs: Goldman Sachs https://t.co/yqY6qXMDFt
The Dow was already flashing concerning reversal signals before Trump reignited the US-China trade war, and now the major stock market index appears primed for a punishing correction.
Dow Jones Technical Outlook Keeps Getting Uglier
Even though Trump all but promised that the US and China would find common ground this week, the uncertainty may have pushed the DJI over the edge. The bulls’ inability to drive the market above 26,600 has given bears the higher ground.
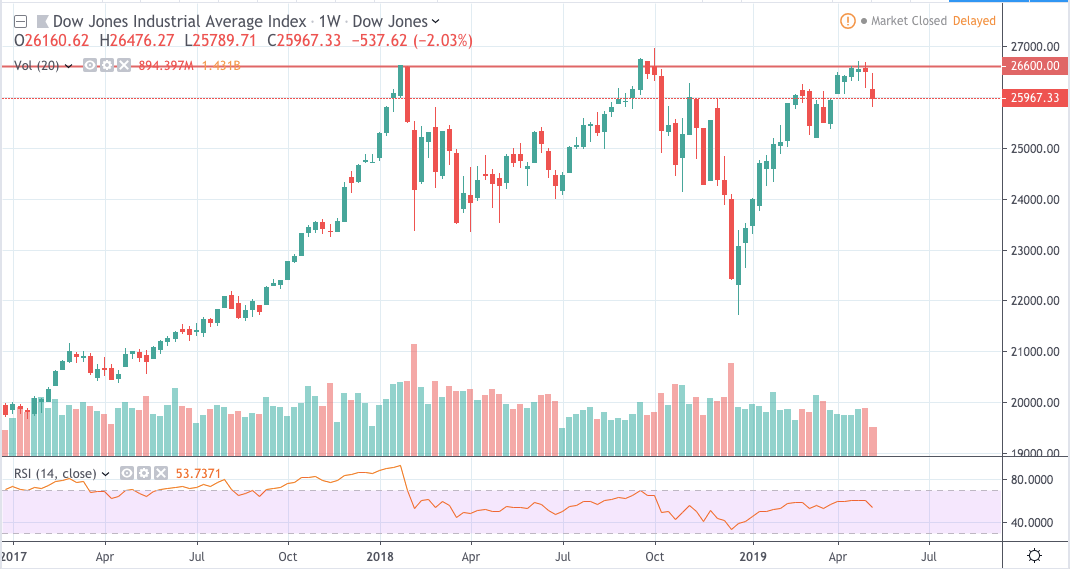
A look at the weekly chart shows that the DJI is printing a triple top pattern. This is a bearish reversal structure that can potentially spell the end of the Dow’s multi-year uptrend.
It’s not every day you see an almost perfect triple top pattern. That’s not a good sign for the stock market bellwether. | Source: TradingView
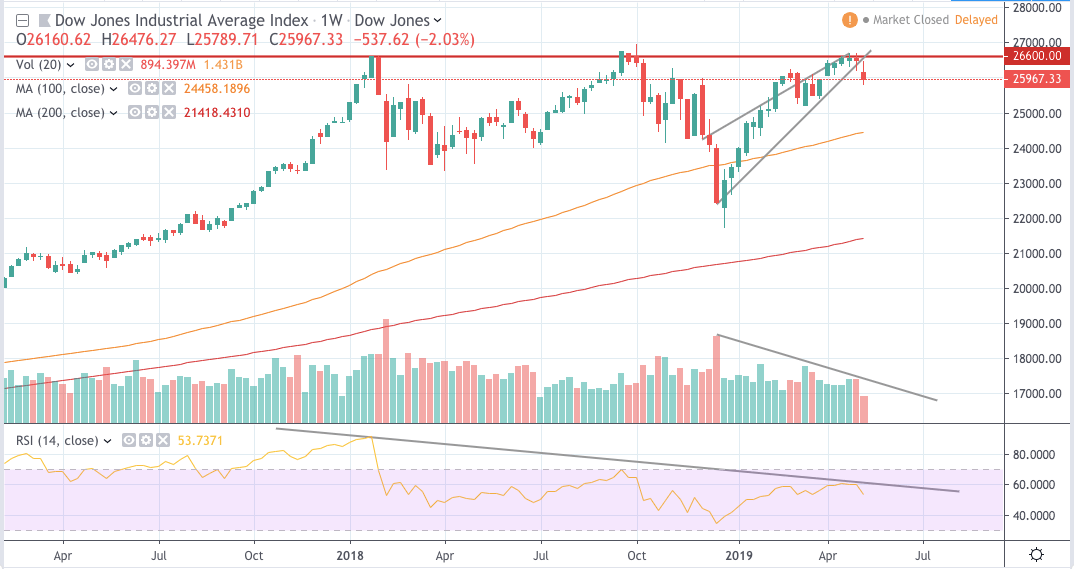
To make matters worse, the Dow appears to have broken down from a rising wedge pattern on the weekly chart. Bulls tried to reclaim the diagonal support of the wedge this week, but bears swiftly repelled the advance. This is a signal that the DJI has some more downside potential.
The bears clearly have the upper hand, as this Dow chart indicates. | Source: TradingView
These are major red flags for investors. The triple top indicates that buyers are no longer interested in buying at current levels. This is confirmed by the rising wedge breakdown as the pattern signifies supply outmuscling demand.
The evidence for bearish control mounts once you look at technical indicators.
Stock Market Characterized by Bullish Exhaustion
The large bearish divergence on the weekly chart speaks of bullish weakness. Without momentum, it would be next to impossible for the DJI to go past durable resistance of 26,600. The signal also affirms our bias that a trend reversal is on the horizon.
Monster divergences in RSI and volume suggest significant market weakness. | Source: TradingView
In addition, the volume has been disappointingly thin. Although the market climbed from lows of 21,712.53 in December 2018 to as high as 26,695.96 in April 2019, there’s been no noticeable spike in volume. This supports our assessment that buyers are losing interest in investing at current levels.
Watch This Key Level for Possible Dow Recovery
Even with the presented bearish signals, all hope is not lost for the Dow. Bulls can rely on durable support of 24,000 to possibly stage a comeback. Fortunately for them, the 100-period moving average (MA) is crawling around that level. The technical indicator will act as additional support for the index.
The 24,000 mark is critical to avoid an all-out DJI collapse. | Source: TradingView
Breach below 24,000 and the DJI’s line in the sand is 21,500. If you’re a long-term investor, consider lightening your positions or taking profits when these levels are taken out.
Bottom Line: Trump Picked a Bad Time to Reignite a Trade War
Trump’s trade war against China comes at an inopportune time as the Dow Jones prints multiple bearish signals. The uncertainty might push the index to the point of no return.
Click here for a real-time Dow Jones Industrial Average price chart.
Kiril is a CFA Charterholder and financial professional with 6+ years of experience in financial writing, analysis, and product ownership. He has a bachelor's degree with a specialty in finance and lives in Canada.
Kiril’s current focus is on finance and cryptocurrencies.
He owns Bitcoin, Ethereum, and other cryptocurrencies. He holds investment positions in the coins but does not engage in short-term or day-trading.