The stock market lost around 50% of its Monday morning rally while the main yield curve on US Treasury bonds suffered another inversion. | Source: REUTERS / Lucas Jackson
Share
By CCN.com: One of the most ironclad recession indicators blared another warning on Monday, as the main yield curve on the US Treasury bond briefly inverted while a bewildered stock market wrestled with conflicting stories about the state of US-China trade relations.
Stock Market Slides as Beijing Claps Back at Trump
The US stock market had executed a spectacular rally at Monday’s opening bell, trading higher on President Trump’s claim that White House officials had spoken to Beijing and planned to return to the negotiating table in the near future.
However, Chinese media sources disputed that claim. Hu Xijin, the editor-in-chief of a Communist Party newspaper, said that the US and China “didn’t hold phone talks in recent days” and that China “won’t cave to US pressure.”
Based on what I know, Chinese and US top negotiators didn't hold phone talks in recent days. The two sides have been keeping contact at technical level, it doesn't have significance that President Trump suggested. China didn't change its position. China won't cave to US pressure.
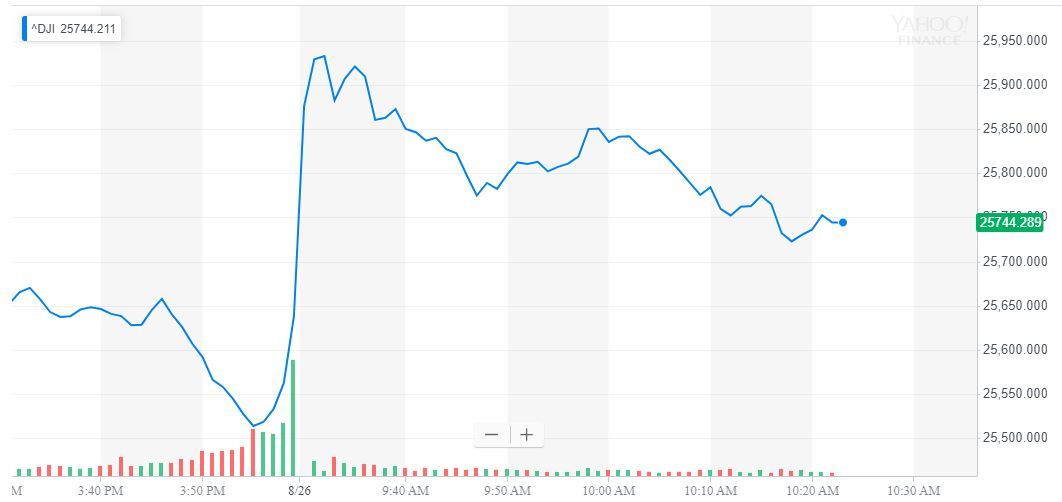
As of 10:25 am ET, the stock market bellwether index had climbed 113.79 points or 0.44%. The DJIA last traded at 25,742.69.
The Dow, which had climbed more than 300 points earlier in the session, has now gained around 115 points. | Source: Yahoo Finance
The S&P 500 and Nasdaq suffered similar setbacks, though they continue to cling to moderate rallies of 0.39% and 0.53%, respectively.
Main Yield Curve Inverts – Again
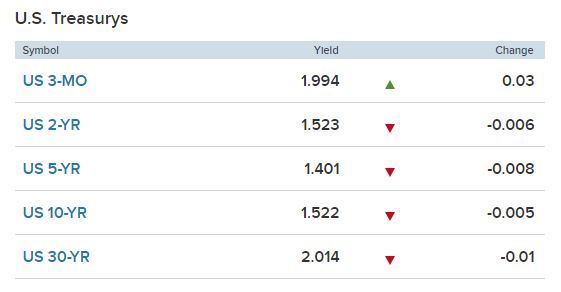
The intraday flight from equities coincided with falling yields on every US Treasury bond except for the 3-month note.
The pullback briefly triggered a yield curve inversion, as the return on the 10-year Treasury bond temporarily fell below the yield on the 2-year note.
The yield on the 10-year Treasury bond briefly slid below the yield on the 2-year note. | Source: CNBC
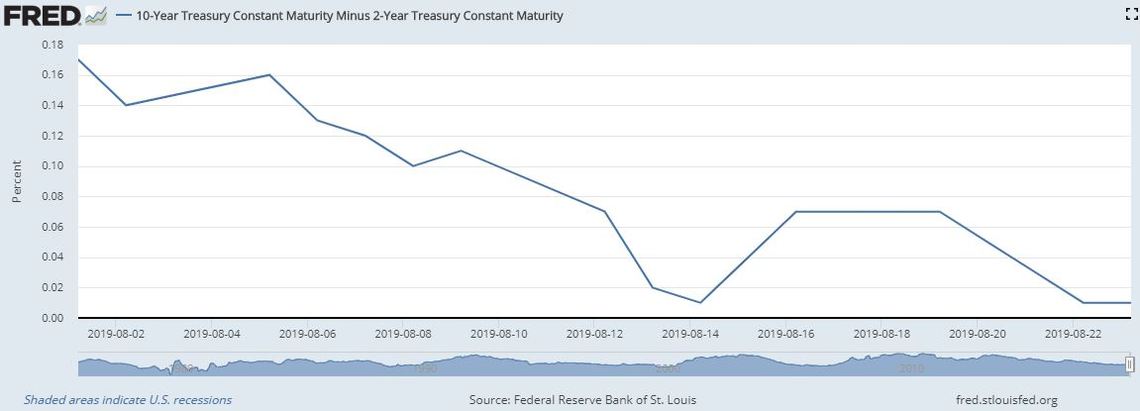
The so-called “main yield curve” is a closely-watched recession signal, as a main yield curve inversion has preceded every recession for the past 50 years (though not every inversion has been followed by a recession).
The main yield curve has inverted on multiple occasions during August, but it has never stayed inverted for long.
The yield curve has flattened in August as investors have rotated capital out of the stock market and into Treasurys. | Source: St. Louis Federal Reserve
Click here for a real-time Dow Jones Industrial Average chart.
Josiah is the former U.S. Editor at CCN.com, where he focused on financial markets. He lives in rural Virginia. Connect with him on LinkedIn or email him directly at josiah.wilmoth(at)www.ccn.com.