Stock Market Faces Critical Test Amid China Tensions & Data Deluge

The stock market faces a critical test this week, as a data deluge, simmering political instability, and the trade war threaten the S&P 500 and Dow Jones. | Source: Drew Angerer / Getty Images / AFP
By CCN.com: The next week could be a bumpy one for the stock market, as domestic wildcards and red-hot trade war tensions threaten to smack the S&P 500 and Dow Jones Industrial Average lower.
China Bogeyman Haunts Stock Market
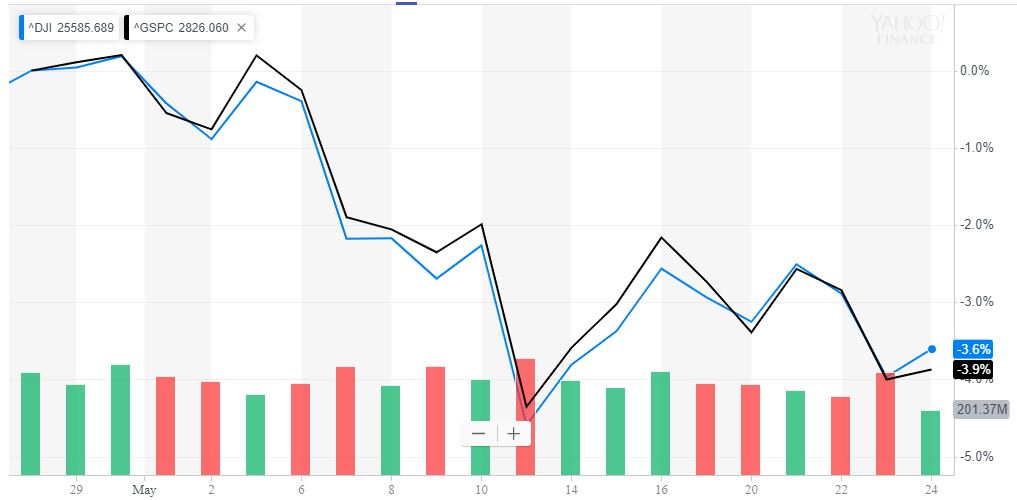
The S&P 500 enters the holiday-shortened trading week at 2,826.06, while the Dow checks in at 25,585.69. Both indices have dropped more than 3.5 percent over the past month.

Issues with China continue to weigh on the stock market. President Donald Trump’s tariff hikes and ongoing trade war rhetoric have made traders, investors, and institutions skittish.
Seemingly every bit of worrisome news that hits the wires regarding China has sent the stock market lower, even though it tends to regain its losses in short order…so far.
As Donald Trump has been keeping China in the news via press conferences and tweets, expect the stock market to be perched on the knife’s edge, ready to react to any negative news.
Democrats Risk Destabilizing the US Political Environment
Another political element that may affect the stock market this next week is the ongoing tussle between Donald Trump and the Democrats in the House. Democrats have pointlessly subpoenaed Trump’s financial records, a political move designed to keep him on the defensive.
The subpoenas have no actual purpose, and there is nothing to support the Democrats in issuing them in the first place. It is simply an ongoing political hit job designed to damage the president.
Although the parties have reached a settlement that allows for a stay in Deutsche Bank and Capital One’s issuing of the records while Trump appeals, this kind of behavior by the Democrats is destabilizing to the market.
Economic Reports Remain a Market Wildcard
There are a few reports due out this week which could send the stock market careening in either direction.
On Tuesday, the stock market will digest the GDP revision for Q1. GDP was 3.2 percent, a solid number showing robust economic growth. A significant upward or downward revision could tank the market.

If the GDP number is revised into the low 2 percent range, it indicates the economy may be unexpectedly slowing.
If GDP is revised too far upwards, it would mean the economy is growing too quickly and might spark fears of an interest rate spike.
The most likely scenario is a 10 basis point move in either direction, but there are always surprises to be prepared for.
Wall Street Watches Consumer Data Deluge with an Evil Eye
On Friday, the stock market gets hit with five important reports in the space of 90 minutes: personal income, consumer spending, core inflation, the Chicago PMI, and Consumer Sentiment Index.
Consumer spending and sentiment are the most critical. Consumer spending is expected to come in at 0.2 percent growth , and the sentiment index is expected to decline from 102.4 to 100.
The stock market will likely cheer any consumer spending growth at all, while any negative number might take the stock market lower by as much as 4%.
With a downdraft in sentiment already baked into the stock market, an upside beat of any kind will likely fuel a rally. If consumers are spending money and feeling optimistic, that bodes well for the economy and for stocks.
Valuation & Technicals Trigger Alarm Bells
When one combines all of these factors with the fact that the stock market is at its third-most expensive valuation in history, there is a greater chance that any unexpected movement in any of the issues highlighted could send the stock market down.
This is augmented by the fact that the technical picture is worrisome.

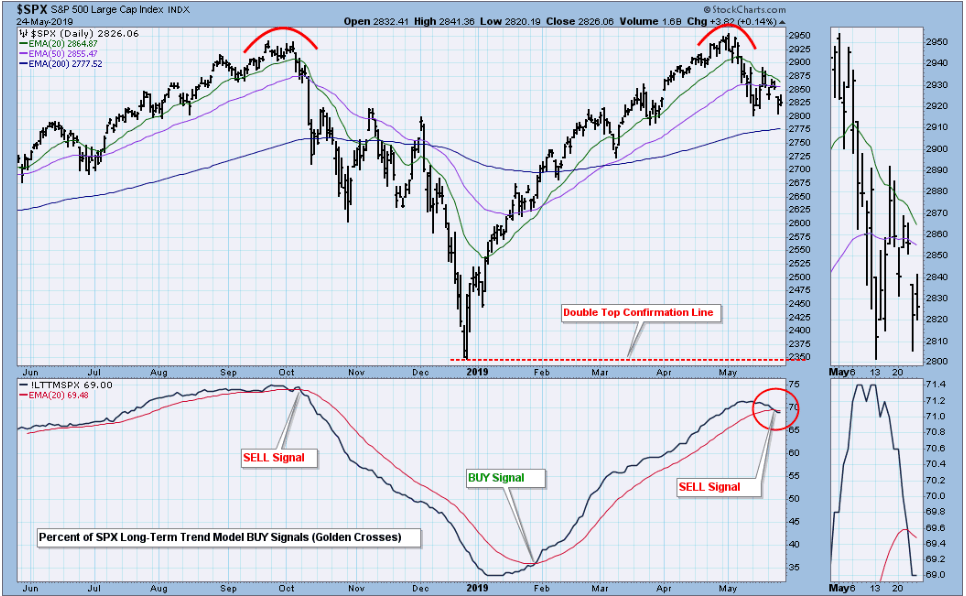
The S&P 500 chart above shows a possible long-term double top and a break through the 20-day and 50-day exponential moving averages.
Next stop is 2,775 on the S&P 500 Large Cap Index.