For all the worry about a housing bubble, the real estate price-to-rent ratio suggests the market is in good health. | Image: AP Photo/John Bazemore, File
Share
Analysts are looking for cracks in the housing market data as the longest economic recovery in U.S. history continues.
But most of the blips in the data are too short term, and not correlated meaningfully with other economic indicators.
Two key data relationships from the demand and supply side show a very healthy recovery that’s likely to last.
Since the Great Recession we’ve seen the longest-running economic recovery in U.S. history. It has left many nervously anticipating a stock market bust or housing crash. From 1854 to 2009, there were 33 business cycles with the upswing lasting 3.2 years on average followed by a 1.5 year correction.
So after a decade of record-setting growth across the board, some investors are apprehensive that the end must be near. Fallout from the housing bubble was so catastrophic, analysts are hyper-vigilant for signs of another crash.
But other than minor blips and bumps that have traumatized forecasters spooked, the pertinent data reveal strong fundamentals and quite sober residential real estate prices. It appears we’ve learned our lesson.
Incremental price increases are to be expected, but the housing market has been seeing reacceleration in home prices as more buyers want to take on lower interest rates in the midst of insufficient supply. Unfortunately, income and wages are not rising as fast and will make it difficult to buy once rates rise.
But this is only technically true according to a slice of the data that’s so narrowly bounded it obfuscates the big picture.
The growth in housing prices dramatically outpaced growth in real median income during the housing bubble that precipitated the Great Recession. Not so during the real estate recovery of recent years.
By contrast the last four years of growth in real estate prices have been far more modest. MSPUS has increased only 5% in the last four years from Q3 2015 to Q3 2019. Over the same time period, median household income has actually outpaced the growth in housing prices with a 7.5% increase.
Median Income, 2015: 59,901 (US Census Bureau)
Median Income, 2018: 63,179 (US Census Bureau)
Median Income, 2019: 64,430 (Sentier Research) 7.5% increase
Median sales prices and income are not the averages, but the most likely value that would turn up if you selected a house sale or household income at random from the entire United States. These figures are useful here to cancel out the effect of outliers at the extreme ends of the distribution.
The data is all sourced from the U.S. Census Bureau via the St. Louis Federal Reserve at the links in the sub-heading above. One exception: 2018 is the most recent year for which the US Census Bureau has real median household income figures. The 2019 median income figure is for June 2019, based on a report by Sentier Research, a firm led by former census officials.
Real Estate Price / Rent Ratio
Another key metric that suggests housing prices reflect a healthy recovery is the ratio of housing prices to rents. The ratio is as important to assessing real estate values as P/E ratios are to assessing stocks.
Many of the most cited media reports on housing in recent weeks focus on the up or down movement of one metric on a very short time scale. This cannot produce a very deep understanding of the housing market. Therefore this shallow level of analysis cannot marshal any reliably predictive powers.
What is a house actually worth technically, financially speaking? What the last guy paid for it? What the next “greater fool” will pay for it during a bubble?
The sales comparison approach to valuing residential real estate amplified the perverse incentives created by housing lenders like Fannie Mae and Freddie Mac. And it served to justify speculative home purchases by greedy and naive borrowers who thought they couldn’t lose.
In Q1 2007 the median house price was $257,400. According to the U.S. Census Bureau (via YCharts) the US median asking rent was $659 in Q1 2007. Annualized to $7,908 for a 12-month lease, the price to rent ratio overall was 32.25 just before the housing crash.
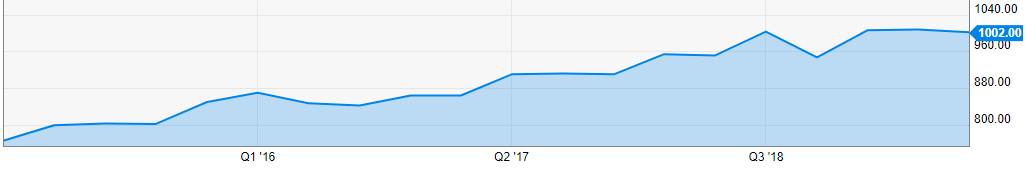
U.S. median asking rent is hovering just above $1,000. | Image: YCharts
In Q3 2019 the median house price was $310,900, and the U.S. median asking rent was $1,002. Annualized to $12,024 for a 12-month lease, the price to rent ratio overall sits at 25.85. So housing prices are more modest today than during the bubble.
Markets Contributor for CCN living in Nashville, Tennessee. Bachelor of Business Administration from Belmont University in 2009 (majored in Entrepreneurship). Organized Senator Rand Paul's first and second online fundraisers in 2009. Roving editor for the Independent Voter Network since 2013. Email me | Link up with me on LinkedIn | Follow Me on Twitter (followed by: fmr Rep. Ron Paul (R-TX), Sen. Rand Paul (R-KY), fmr NM Gov. Gary Johnson, and Rep. Thomas Massie (R-KY))