

 In the past few days, we advised traders to consider taking profits ~$344. It turns out that the magic number was a few dollars shy of that figure ($338). We also suggested that when the next pullback occurred we could possibly get a test of the long term support line. As I am writing these words, price has touched that support line. For now at least, that support is holding. See the 3-day chart below.
As long as we do not get a close below that support line I will remain medium-term bullish. I continue to expect that the market will rise as soon as the price passes through the 2nd arc resistance seen on the 1-day chart below. However, if we get a close on the 3-day chart below that support line I will break out my bearish setups again. Let’s see what the next few days bring.
3-Day Chart
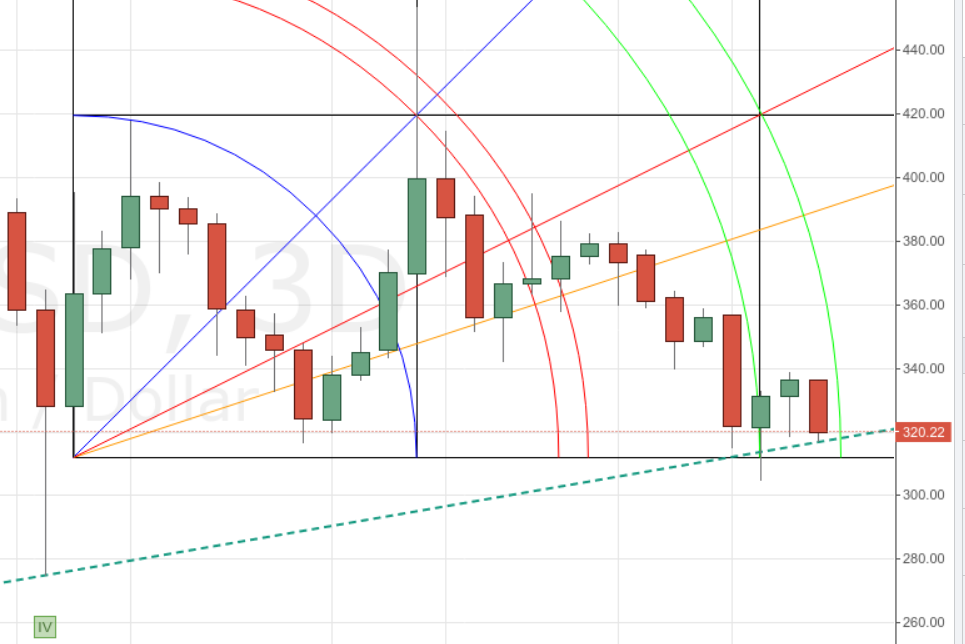
The long term support seen on this chart is not trivial. As long as we do not get a close below the long term support, we can expect that the market will go up from here. Conversely, a close below this line will be a bearish signal. Note that the candle does not close for two more days, so do not panic if the price dips below the line briefly in the meantime.
1-Day Chart
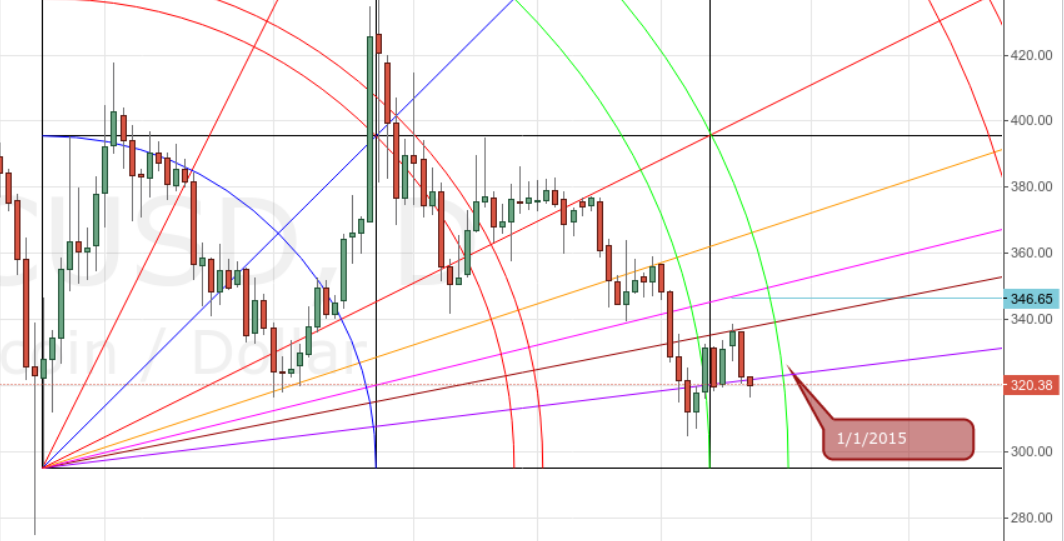
I would feel better about this chart if price gets back above the purple 8×1 Gann fan line. But as long as the price remains within the 2nd arc’s influence, it is constrained. As you can see, it will take several more days to clear the arc pair. Interestingly, both the 3- and 1-day charts exit 2nd arc resistance at ~ 1/1/15 (at the latest).
2-Hour Chart
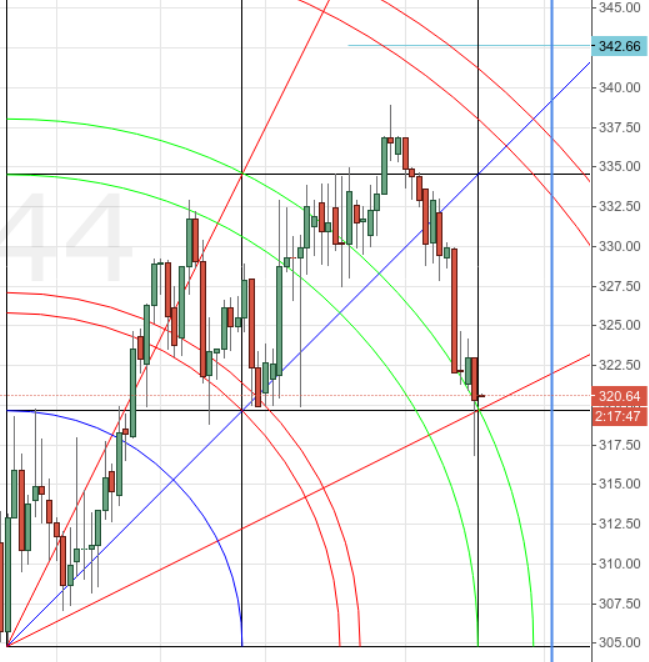
This chart is quite interesting. We didn’t get to the 3rd arc as I expected. (The 3rd arc was the source of the $344 resistance I warned about two days ago.) However, price has fallen, so far, exactly to the 2×1 Gann fan. It also found support at the top of the square and the top of the 2nd arc. (See close-up of the chart below.) We are at the end of the current square, so this time-frame may see a change in trend.
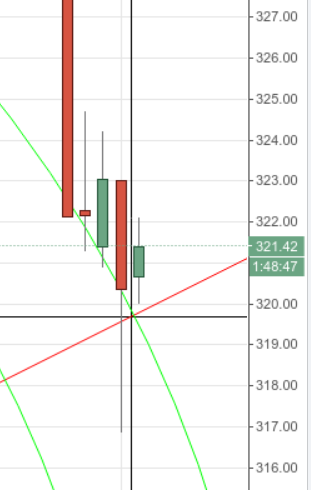
There is a lot of support right here. It may not break. Having said that, if this support does break with a close below 319, the next support will be ~ 314. Let’s see what happens next….
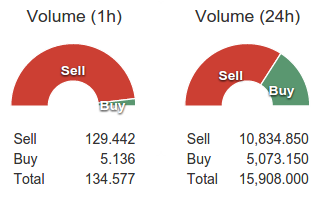
The price ratio page shows there are currently many more sellers than buyers.
Happy Trading all!
Disclaimer: Trading is risky. Past success is not a guarantee of future profits. CCN.com assumes no liability for any losses suffered as a result of this analysis.
