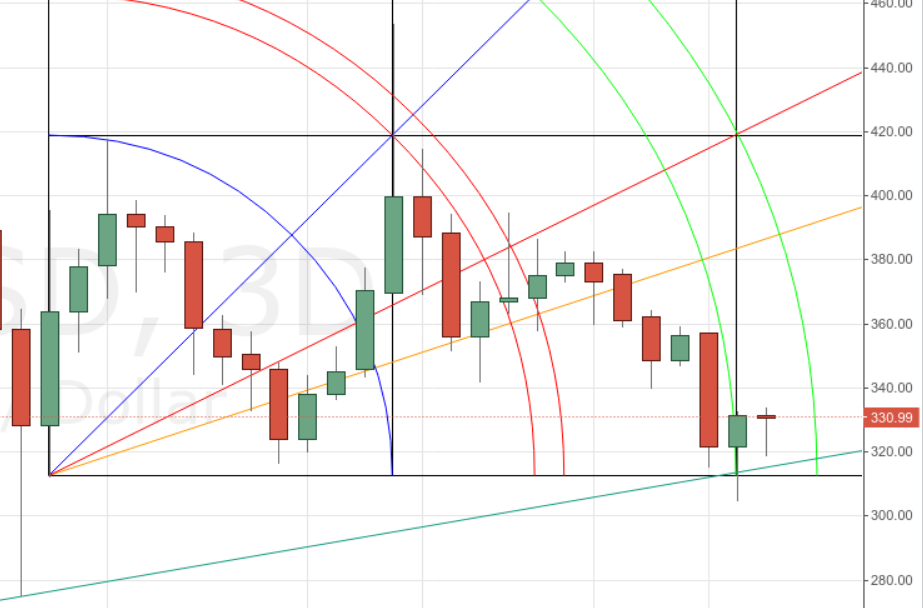
Bitcoin price has been trading in a relatively narrow range of $320-$334 for the past day or so. I expect that it will break out of this range soon. Overhead resistance had been tested and held on a few occasions, but we broke through that resistance as this article was being written.
3-Day Chart
To touch the long term support line, price on the 3-day chart would need to fall to $315. But I would be surprised if it goes there. If it does, it will cause me to sit up and take notice, no doubt. This chart will clear 2nd arc resistance no later than Jan 1, 2015. From there, there will be little overhead resistance until $420.
1-Day Chart
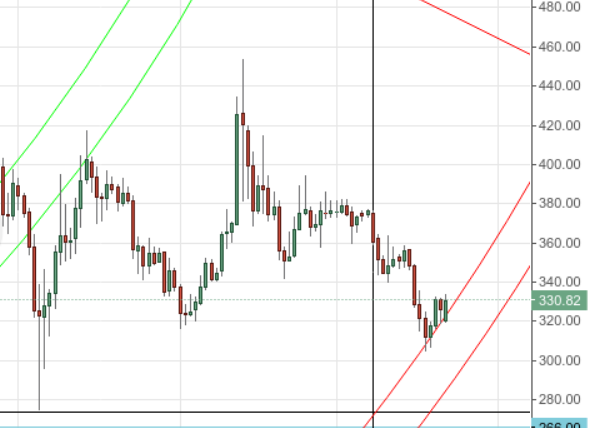
Yesterday I realized that if I make a very small adjustment in the bearish setup we have been following for several weeks, price has already actually touched the 5th arc. It has since been following the arc upwards. Barring any (very) unexpected crash in price, I consider this setup as “complete” and will not refer to it again.
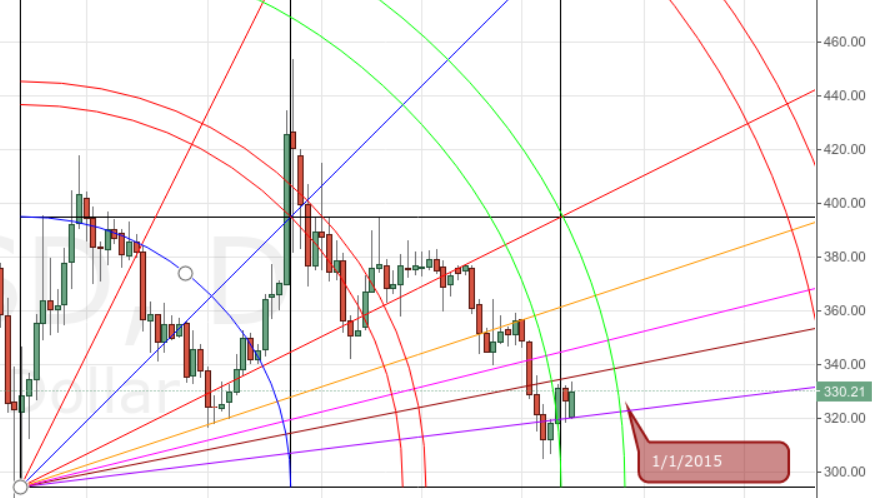
In this bullish setup of the daily chart price has penetrated the 1st layer of 2nd arc resistance. It is being supported by the Gann 8×1. This chart is not terribly bullish, but it is more bullish than bearish. Price will be free of 2nd arc resistance no later than Jan 1, 2015. Interesting that this chart shows price clearing resistance in the same time-frame as the 3-day chart…
5-Hour Chart
Bitcoin Price just closed above the 2nd arc. That gives us a buy signal.
IMO those who took this columns advice and went long at $304 should consider taking profits ~$344. I imagine that the 3rd arc will repel price. Assuming that we get to $344 w/o any surprises, those who went long at $304 will have made ~$40/btc. Not bad for a couple days work! I expect we will get to that target within the next 13 hours from this writing.
34-minute Chart
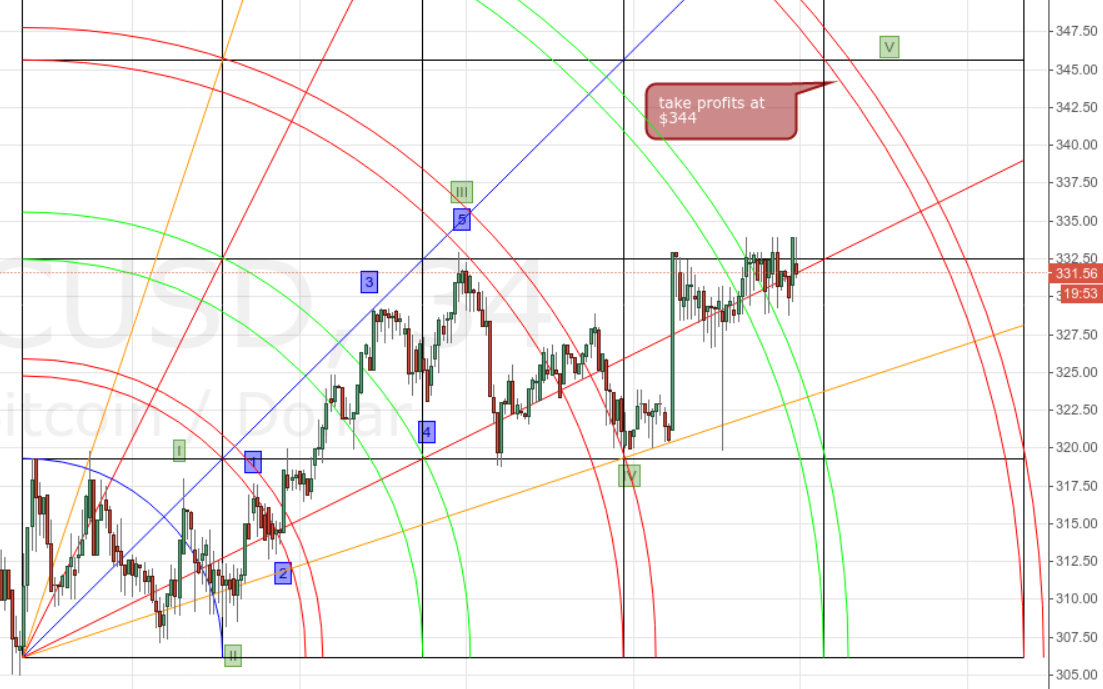
This chart shows (so far) four waves of a five wave structure up. Price is being supported by the Gann 2×1 fan. The 5th wave will likely end just as the price touches the 5th arc ~$344. This chart is giving the same warning to long traders that the 5-hour chart gave: take profits at $344. My suggestion is that long traders heed the warning. Take profits and remember to say thank you to William Gann and Ralph Elliott in your prayers.
Aggressive traders might consider a short at $344. Just remember you will be scalping against the trend if you do so. Be careful. (Feel free to sign up for my email list by emailing me directly.)
The price ratio page shows there are currently more buyers than sellers.

Happy Trading all!
Disclaimer: Trading is risky. Past success is not a guarantee of future profits. CCN.com assumes no liability for any losses suffered as a result of this analysis.
Images from Shutterstock.


