Bitcoin price on Thursday extended its prevailing bearish correction sentiment and dropped as much as 6.5 percent from the yesterday’s low near $6,710.
The BTC/USD in the very first hours of today’s session formed lower highs and lower lows towards 6731-fiat and 6303-fiat. It very much set the sentimental course for the rest of the Asian and European session. Both the trading sessions lacked strong bullish corrections, putting BTC/USD on a slow path to the downside. At the early European hours, the pair retested 6306-fiat as the range bottom, only to recover towards 6500-fiat.
In the opinion of many strategists, Goldman Sachs’ decision to halt its long-planned cryptocurrency desk over regulatory issues caused the latest BTC/USD correction. However, the factor is too lousy to correlate for a market that has been in a massive bearish formation since November 2017. Even in the recent price action, we noticed the pair’s bullish momentum getting slowed down near our previous Rising Wedge resistance. We had expected a breakout scenario, anyway.

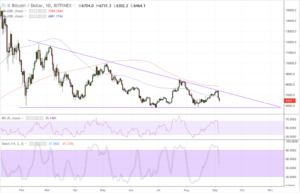
As we can notice, the BTC/USD is already inside a massive descending triangle, giving us enough hints of both previous and potential upside reversals. So far, we have not broken below the lower support – the pair bottom around 5800-fiat – so a run towards the said level followed by a reversal should not surprise. If we manage to extend the repeal such that upper trendline is broken, we could expect a run towards the previous lower high around 8490-8500 area.
RelatedNews
BTC/USD Technical Analysis

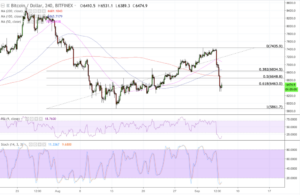
The BTC/USD has slipped below its near- and long-term moving averages following the bear action. The 50H MA has its head towards the south and should mean an extended breakdown session if it crosses below the 100H MA. In case the 50H MA crosses below the 200H MA, then it will be a death cross scenario which could mean a breakdown below the descending channel support discussed above.
The RSI and Stochastic Oscillator both have slipped inside their respective oversold areas. The technical indicators – all together – point to strong selling sentiment. in the Bitcoin market.
BTC/USD Intraday Analysis

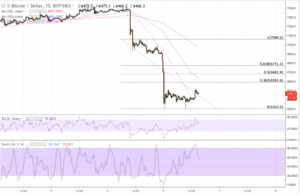
Bitcoin is attempting an upside correction on a bounce back from its intraday low at 6303-fiat and is targeting 6500-fiat as its psychological resistance. Naturally, it is the range we are watching out for today.
To begin with, we are waiting for a breakout above 6500-fiat to clear our long position towards the 100H MA. A stop-loss meanwhile around 2-pips below the entry position would protect us from an extended bearish correction. Looking the other way, a break below support would have us enter a short towards 6150, our downside target.
Trade safely!
Featured image from Shutterstock. Charts from TradingView .
