


Bitcoin Price continued to establish new intraday highs on Tuesday bouncing from this week’s bottom near $6,559.
The BTC/USD pair was hinting a strong push towards 7000-fiat while being on a slow-and-steady upside trend. Since its infamous 30-minute crash, the pair has come a long way to establish a new monthly high at 7127-fiat. On Tuesday, BTC/USD simply continued upward in presence of strong bullish sentiment. The pair underwent small correction only during the early Asian trading session but was supported by a favorable buying sentiment around 6850-6950-area. For the rest of the Asian and the ongoing European session, the bias remained favorable to bulls.
As the US session begins, let’s see how the Bitcoin market is hoping to be played out.
BTC/USD Technical Analysis
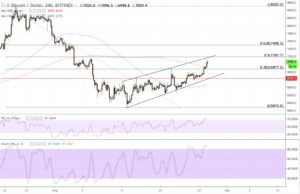
The latest uptrend has brought BTC/USD closer to the resistance of our rising wedge, introduced first in our August 23 analysis. Earlier, we had predicted a run towards the said level and we are closer to testing it, should the pair stays on its uptrend for few more dollars. A breakout above the Rising Wedge in traditional sense could mean an extended run which is equal to the distance between the origin points of our rising wedge parameters. In this case, the distance between our upper and lower trendline is more than $700. We don’t expect the breakout to strictly follow the Wedge rule. But still, an extended uptrend, even lower than $700, could improve the medium-term bullish sentiment, while bringing 8000-fiat back in sight as a potential upside target.
RelatedNews
In the meantime, the BTC/USD is without a doubt in a strong bullish bias, medium-term. The pair has breached its 200H MA to the upside and is further supported by a rising 100H SMA below it. Both the RSI and the Stochastic indicator have entered their respective overbought areas, which could mean a potential bearish correction.
BTCUSD Intraday Analysis
As far as our intraday analysis is concerned, our positions from yesterday are in good shape. We first expect a small correction towards 6877-fiat, which could mean a profitable intrarange short position. At the same time, putting a stop loss three-pips above the entry position would minimize our losses in case the uptrend resumes.
A bounce back from 6877-fiat would mean a smooth run towards the intraday high at 7127-fiat. Therefore, a long position towards the said level could yield decent profits for day traders. But, let’s put our stop loss four-pips below the entry point just to avoid potential losses.
Featured image from Shutterstock. Charts from TradingView.


