The bitcoin price continues to trade sideways on Monday after a stable showing during the weekend on the daily charts. The bitcoin-to-dollar exchange rate is trading at 6398-fiat at the time of writing, 0.85 percent lower than its Sunday high. The pair has found a…
The bitcoin price continues to trade sideways on Monday after a stable showing during the weekend on the daily charts.
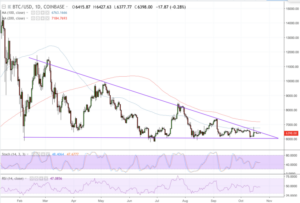
The bitcoin-to-dollar exchange rate is trading at 6398-fiat at the time of writing, 0.85 percent lower than its Sunday high. The pair has found a decent support area in 6350-6400-fiat zone. But, it does not signal enough buying sentiment to break above the giant descending trendline. BTC/USD also formed another Doji on Sunday, confirming an equilibrium between bulls and bears. Frankly, the market is in a long-term bearish bias, so any of these overlong bias conflicts in near-term could intensify its previous selling sentiment.
Bitcoin-USD 1D Chart | Coinbase | TradingView.com
A reversal from here on daily charts could put BTC/USD towards the direction of the well-marketed bottom near 6000-fiat. There could be accumulation, as evidenced by historical price action. And the pair might take another shot at the descending trendline above. Nevertheless, BTC/USD is consolidating inside a triangle range that is narrowing every day, suggesting that breakout/breakdown action would be too imminent.
A breakout from here, meanwhile, could put the pair on a path towards the 100H moving average, while still confirming a bull trap scenario discussed in one of our previous analysis. Long story short, the market would need a mad bull run, maybe towards $10,000 to even confirm a stable medium-term bullish bias.
We’ll focus on our day trading, in the meantime, to try to make out the maximum profits we can get out of the intraday price action.
BTC/USD Intraday Analysis
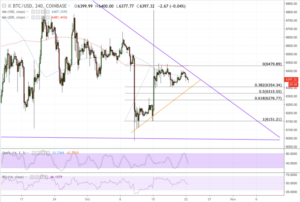
Bitcoin-USD 4H Chart | Coinbase | TradingView.com
We are inside the last leg of our Fibonacci retracement graph drawn from 6151-low to 6479-high. We are now targeting 6354-fiat as our interim support. The resistance, at the same time, is towards 6479-6500 area. We are also expecting an early pullback action from the descending trendline in purple.
To begin with, we have already entered a short position towards 6354-fiat after a close below the intraday high near 6453-fiat while maintaining a stop loss near 6457-fiat. Simultaneously, a pullback action coupled with an increase in volume anywhere above the support area and near-term ascending trendline in saffron would have us open a long position towards the descending trendline. A further break, and we’ll put a similar position towards interim resistance. On both, a stop loss somewhere 4-pips below the entry position would define our risk management perspective.
Meanwhile, a breakdown action below support area would us enter a short position towards 6315-fiat. A stop-loss trade 3-pips above the entry position would minimize our losses should there be a price action reversal.
Featured Image from Shutterstock. Charts from TradingView.
New Delhi-based Yashu Gola has been working as a financial/crypto market journalist since 2013. He is an information technology graduate, a cryptography junkie, a filmmaking enthusiast, and an avid reader of Jon Erickson, Agatha Christie, JK Rowling, and Isaac Asimov.