Things may be looking sparkly for the S&P 500, but a closer inspection suggests that a massive correction may be just around the corner. | Source: Shutterstock
Share
By CCN.com: The S&P 500 (SPX) is up by 18.9% year-to-date and investors are euphoric. According to CNBC, this is the market’s best start in more than three decades. History shows that the S&P 500 has never sustained strong starts. The same CNBC article revealed that in the four years since World War II that the S&P was up by at least 15%, the market ended the year flat or significantly down. Based on our technical analysis, that trend is very likely to continue this year. In this article, we reveal why a deep correction looms for SPX.
S&P 500 Showing Multiple Patterns That Scream Retracement
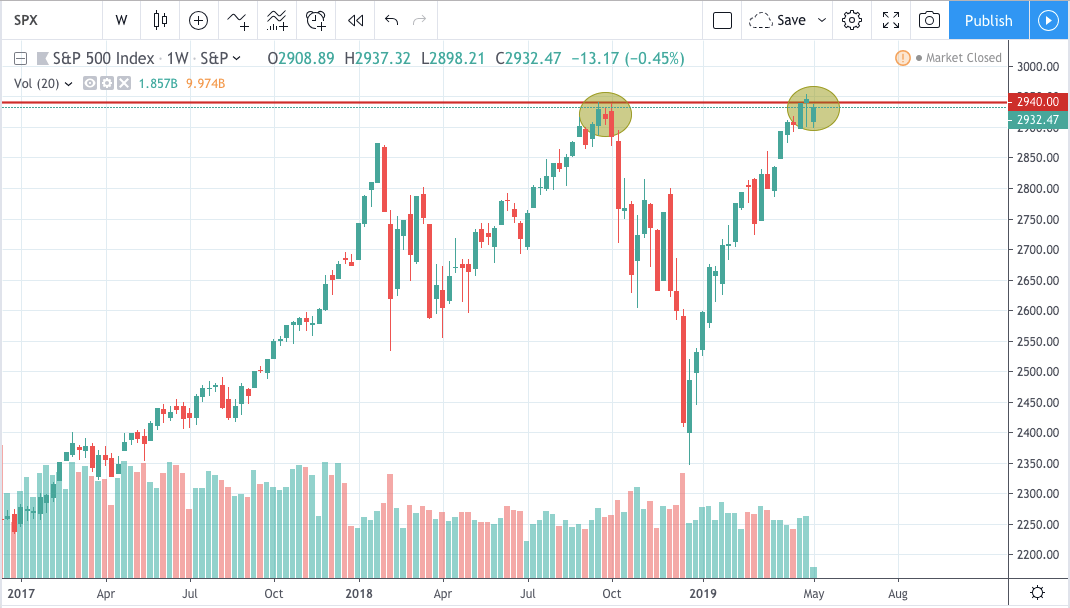
If you’re looking to buy stocks because you heard someone made bank, you might want to hold your horses. The stock market is showing strong toppish signals. One pattern that technical analysts are wary of is the double-top structure. A double top signifies that the market has hit a major barrier and the chances of a deep correction are very likely. We’re seeing this pattern develop in the S&P 500.
SPX struggles to go above a key resistance | Source: TradingView
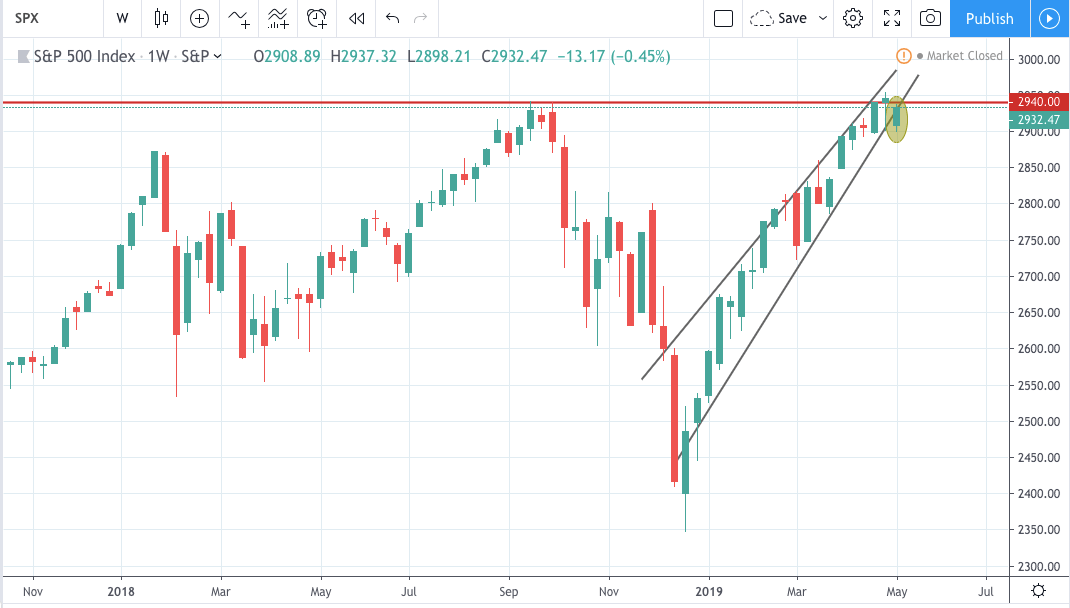
In addition to the double-top pattern, SPX is also flashing a rising wedge. This is a bearish pattern indicating that supply will eventually overpower demand. We’re currently seeing the market hang on for dear life while it struggles to go higher.
SPX remarkable ascent may be coming to a screeching halt | Source: TradingView
These patterns alone bode ominous signs for the stock market. These signals are compounded by bearish technical indicators.
Volume and RSI Undeniably Bearish
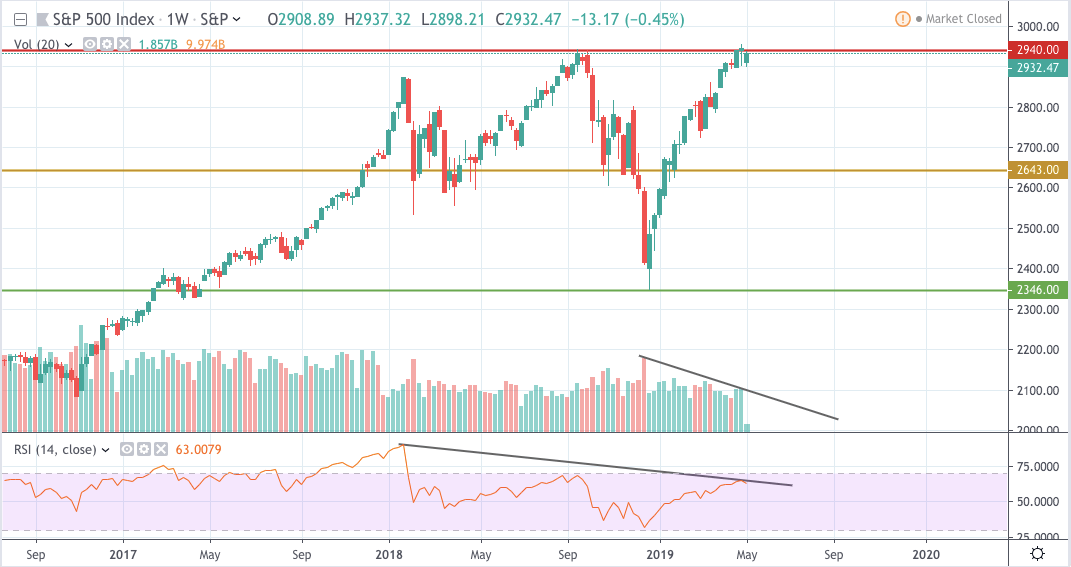
The large bearish divergence on the weekly chart is aggravating the prospects of the S&P 500 to go above 3,000 soon. This signal foreshadows a possible reversal in the bullish trend. It reveals that bulls are losing steam and are not likely able to sustain the leg up.
Volume and RSI declining but the market keeps on climbing | Source: TradingView
On top of that, volume has also been on a decline. The market has gone from the bottom end of the range at 2,346.58 in December 2018 to 2,954.13 in April 2019. That’s an increase of more than 25% in four months yet there’s no significant spike in volume throughout the run. This is another reason to suspect that the current ascent cannot be sustained.
When the Correction Starts, Expect Big Down Moves
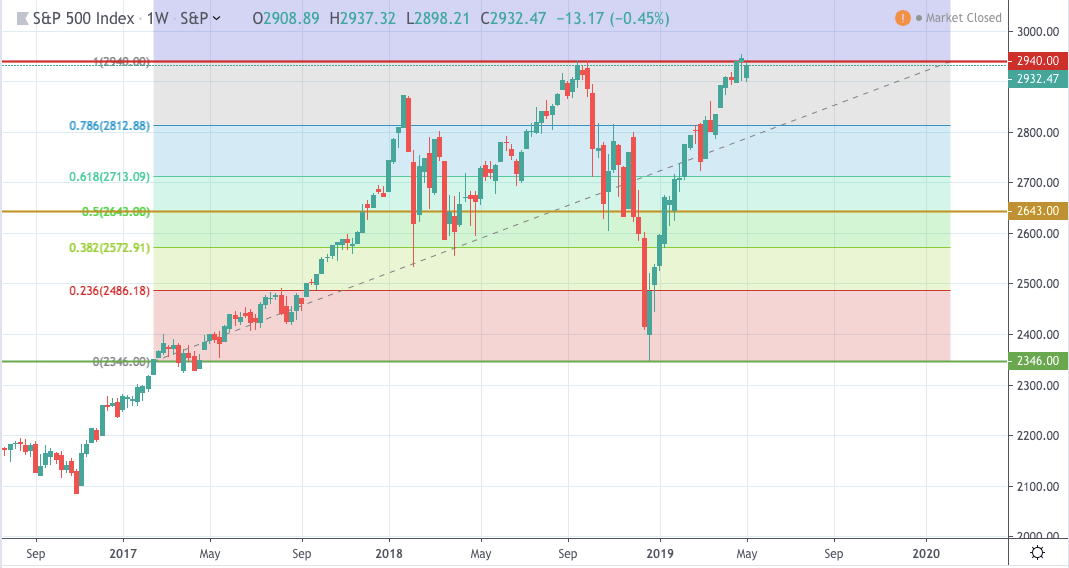
With the signals we presented, a correction appears to be imminent. What is pretty scary about the SPX is that it failed to build a base on its way up. This means that there’s very little to no support that can keep prices stable once profit-taking commences. Looking at the weekly chart, it appears that only 2,643 offers a reliable refuge for bulls.
SPX has gone up so fast that it risks a big crash | Source: TradingView
Below 2,643, the next reliable support is 2,346. These are the levels you should watch if you’re playing for a bounce or recovery.
Bottom Line
Things may be looking sparkly for the S&P 500, but a closer inspection suggests that a massive correction may be just around the corner. It would be best to be patient. You don’t want to get caught up in a huge wave of profit-taking.
Kiril is a CFA Charterholder and financial professional with 6+ years of experience in financial writing, analysis, and product ownership. He has a bachelor's degree with a specialty in finance and lives in Canada.
Kiril’s current focus is on finance and cryptocurrencies.
He owns Bitcoin, Ethereum, and other cryptocurrencies. He holds investment positions in the coins but does not engage in short-term or day-trading.