The Elliott Wave analysis suggests the corrective phase is complete, with a new impulsive wave possibly starting.
Price is testing key horizontal resistance at $0.45-$0.50.
Immediate support lies near $0.40, critical for sustaining upward movement.
After reaching values above $0.60 in November last year, the price of Stellar (XLM) was in a corrective stage. As the correction developed and formed a descending wedge, we saw its completion and eventually a breakout.
Strong bullish momentum leads to a rise of over 40%, but has reached a significant horizontal zone. An interaction result awaits, but more upside should be primarily expected after a local consolidation.
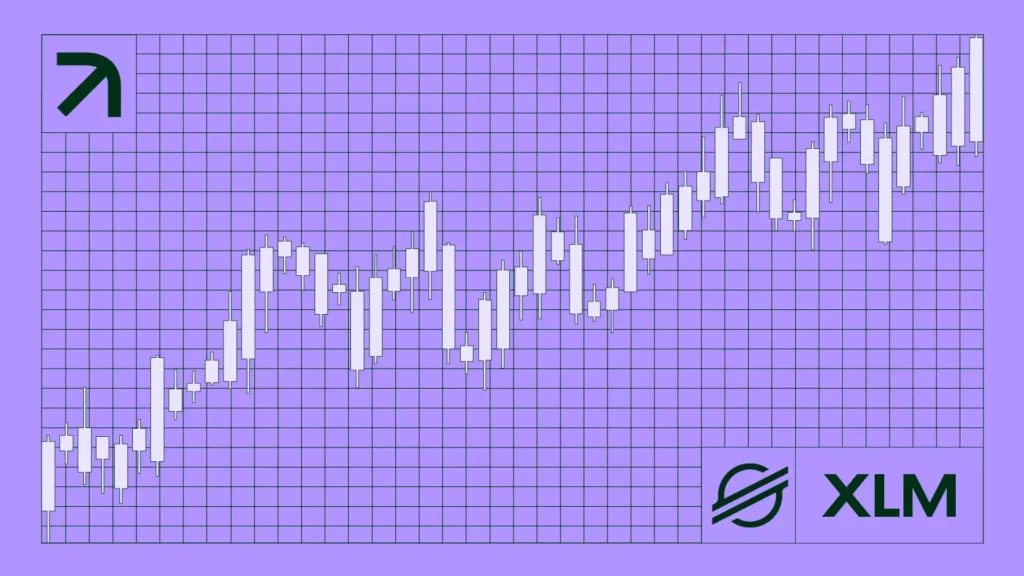
The 4-hour XLM chart demonstrates a notable breakout from a descending wedge pattern, marking a bullish reversal. The price has moved upward sharply, breaking through previous resistance zones, and came to a high of $0.45 from a low of $0.32, on Jan 1.
XLMUSD 40 gain since the start of the year | Credit: Nikola Lazic/TradingView
This breakout coincides with an oversold Relative Strength Index (RSI) condition recovering to bullish levels, reflecting growing buying pressure, but has now reached overbought levels. In addition, the price came to the significant horizontal resistance zone, keeping the price below $0.45.
Wave labeling indicates an Elliott Wave pattern, suggesting the completion of a five-wave impulsive structure followed by a corrective ABCDE pattern until Dec. 20. The subsequent breakout aligns with the completion of the correction, potentially initiating a new impulsive wave.
The RSI’s upward movement aligns with this bullish outlook, signaling further upward potential if momentum sustains.
A decisive close above the $0.45 range could confirm a continued bullish trajectory. If rejected, the price might retest immediately at around $0.40. Momentum will need confirmation through sustained volume and positive sentiment.
XLM Price Prediction
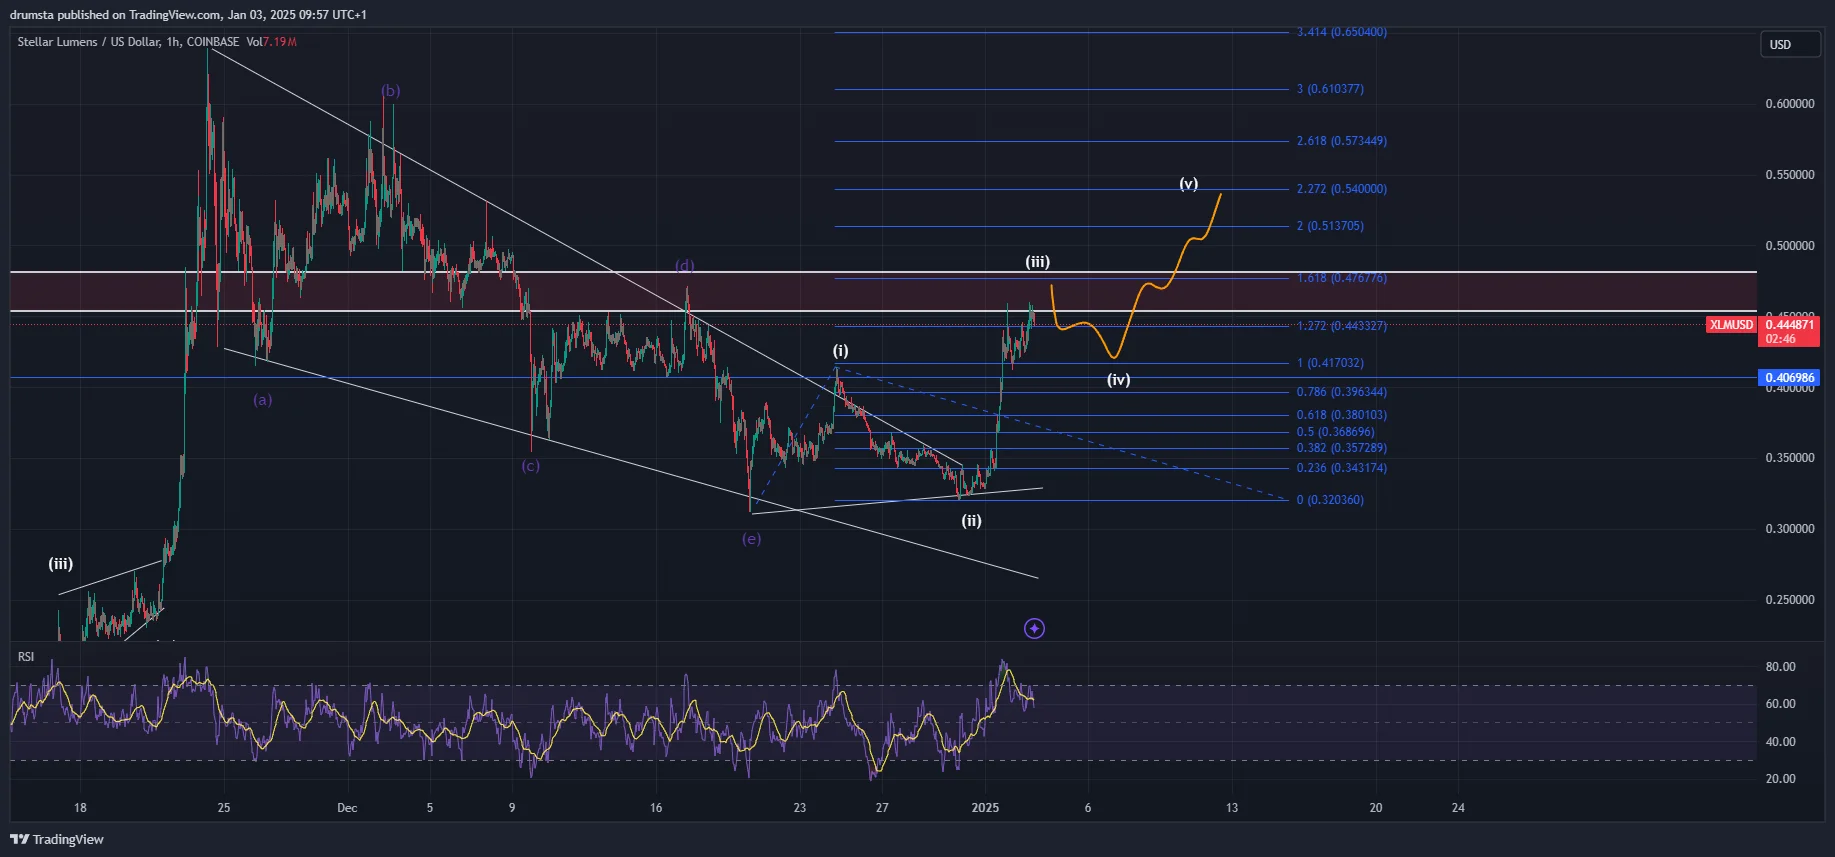
The hourly chart reveals a clear Fibonacci retracement and extension setup, suggesting potential price targets for XLM.
The breakout above the descending wedge pattern was likely wave 3 from the developing five-wave impulse since Dec. 20.
A Fibonacci extension level at 1.618 ($0.47676) acts as the next significant resistance, aligning with historical price rejections.
XLMUSD local consolidation now likely | Credit: Nikola Lazic/TradingView
The corrective wave 4 is projected to retest lower levels around $0.44 or $0.417. The final fifth wave could aim for extensions up to $0.513 or $0.54, as indicated by the 2.0 and 2.272 Fibonacci levels.
RSI momentum remains strong, but a slight divergence could indicate a short-term pullback before the next leg up. A failure to hold above $0.40 (key support) could invalidate the bullish scenario, leading to deeper retracements towards $0.38 or $0.343 (38.2% and 23.6% Fibonacci retracement levels).
Critical Zone for Reversal: Below $0.40 may invalidate the bullish wave count.
Disclaimer:
The information provided in this article is for informational purposes only. It is not intended to be, nor should it be construed as, financial advice. We do not make any warranties regarding the completeness, reliability, or accuracy of this information. All investments involve risk, and past performance does not guarantee future results. We recommend consulting a financial advisor before making any investment decisions.
Nikola Lazic is a cryptocurrency analyst and investor working in the industry since 2017. He holds a bachelor's degree in Sociology, which enables him to better understand the psychology behind the crowd´s positioning. Consequently his preferred analytical tool is Elliott Wave Theory in combination with price action analysis.
Combining his experience in trading and investing with knowledge in content writing he strives to bring the most accurate and actionable information.