H, the native token of Humanity Protocol’s decentralized identity network, is today’s top crypto gainer, surging 33% in the past 24 hours.
Technical indicators are turning constructive for H, with price holding above the 20-day EMA and the MACD printing a bullish crossover.
While derivatives sentiment has flipped bullish with a long/short ratio of 1.04, a dense liquidation cluster around $0.121 poses a key downside risk.
H, the native utility token that powers Humanity Protocol’s decentralized identity network, is today’s top-performing cryptocurrency.
The token is up 33% over the past 24 hours, continuing yesterday’s momentum, when H surged 41% and closed at a 15-day high.
That rally has shown no signs of cooling. As demand continues to soar, H has added another 30% in the past day alone, with trading volume spiking over 500%, a signal that market participation is intensifying and fresh capital is flowing into the token.
H’s Indicators Point Toward Continued Upside
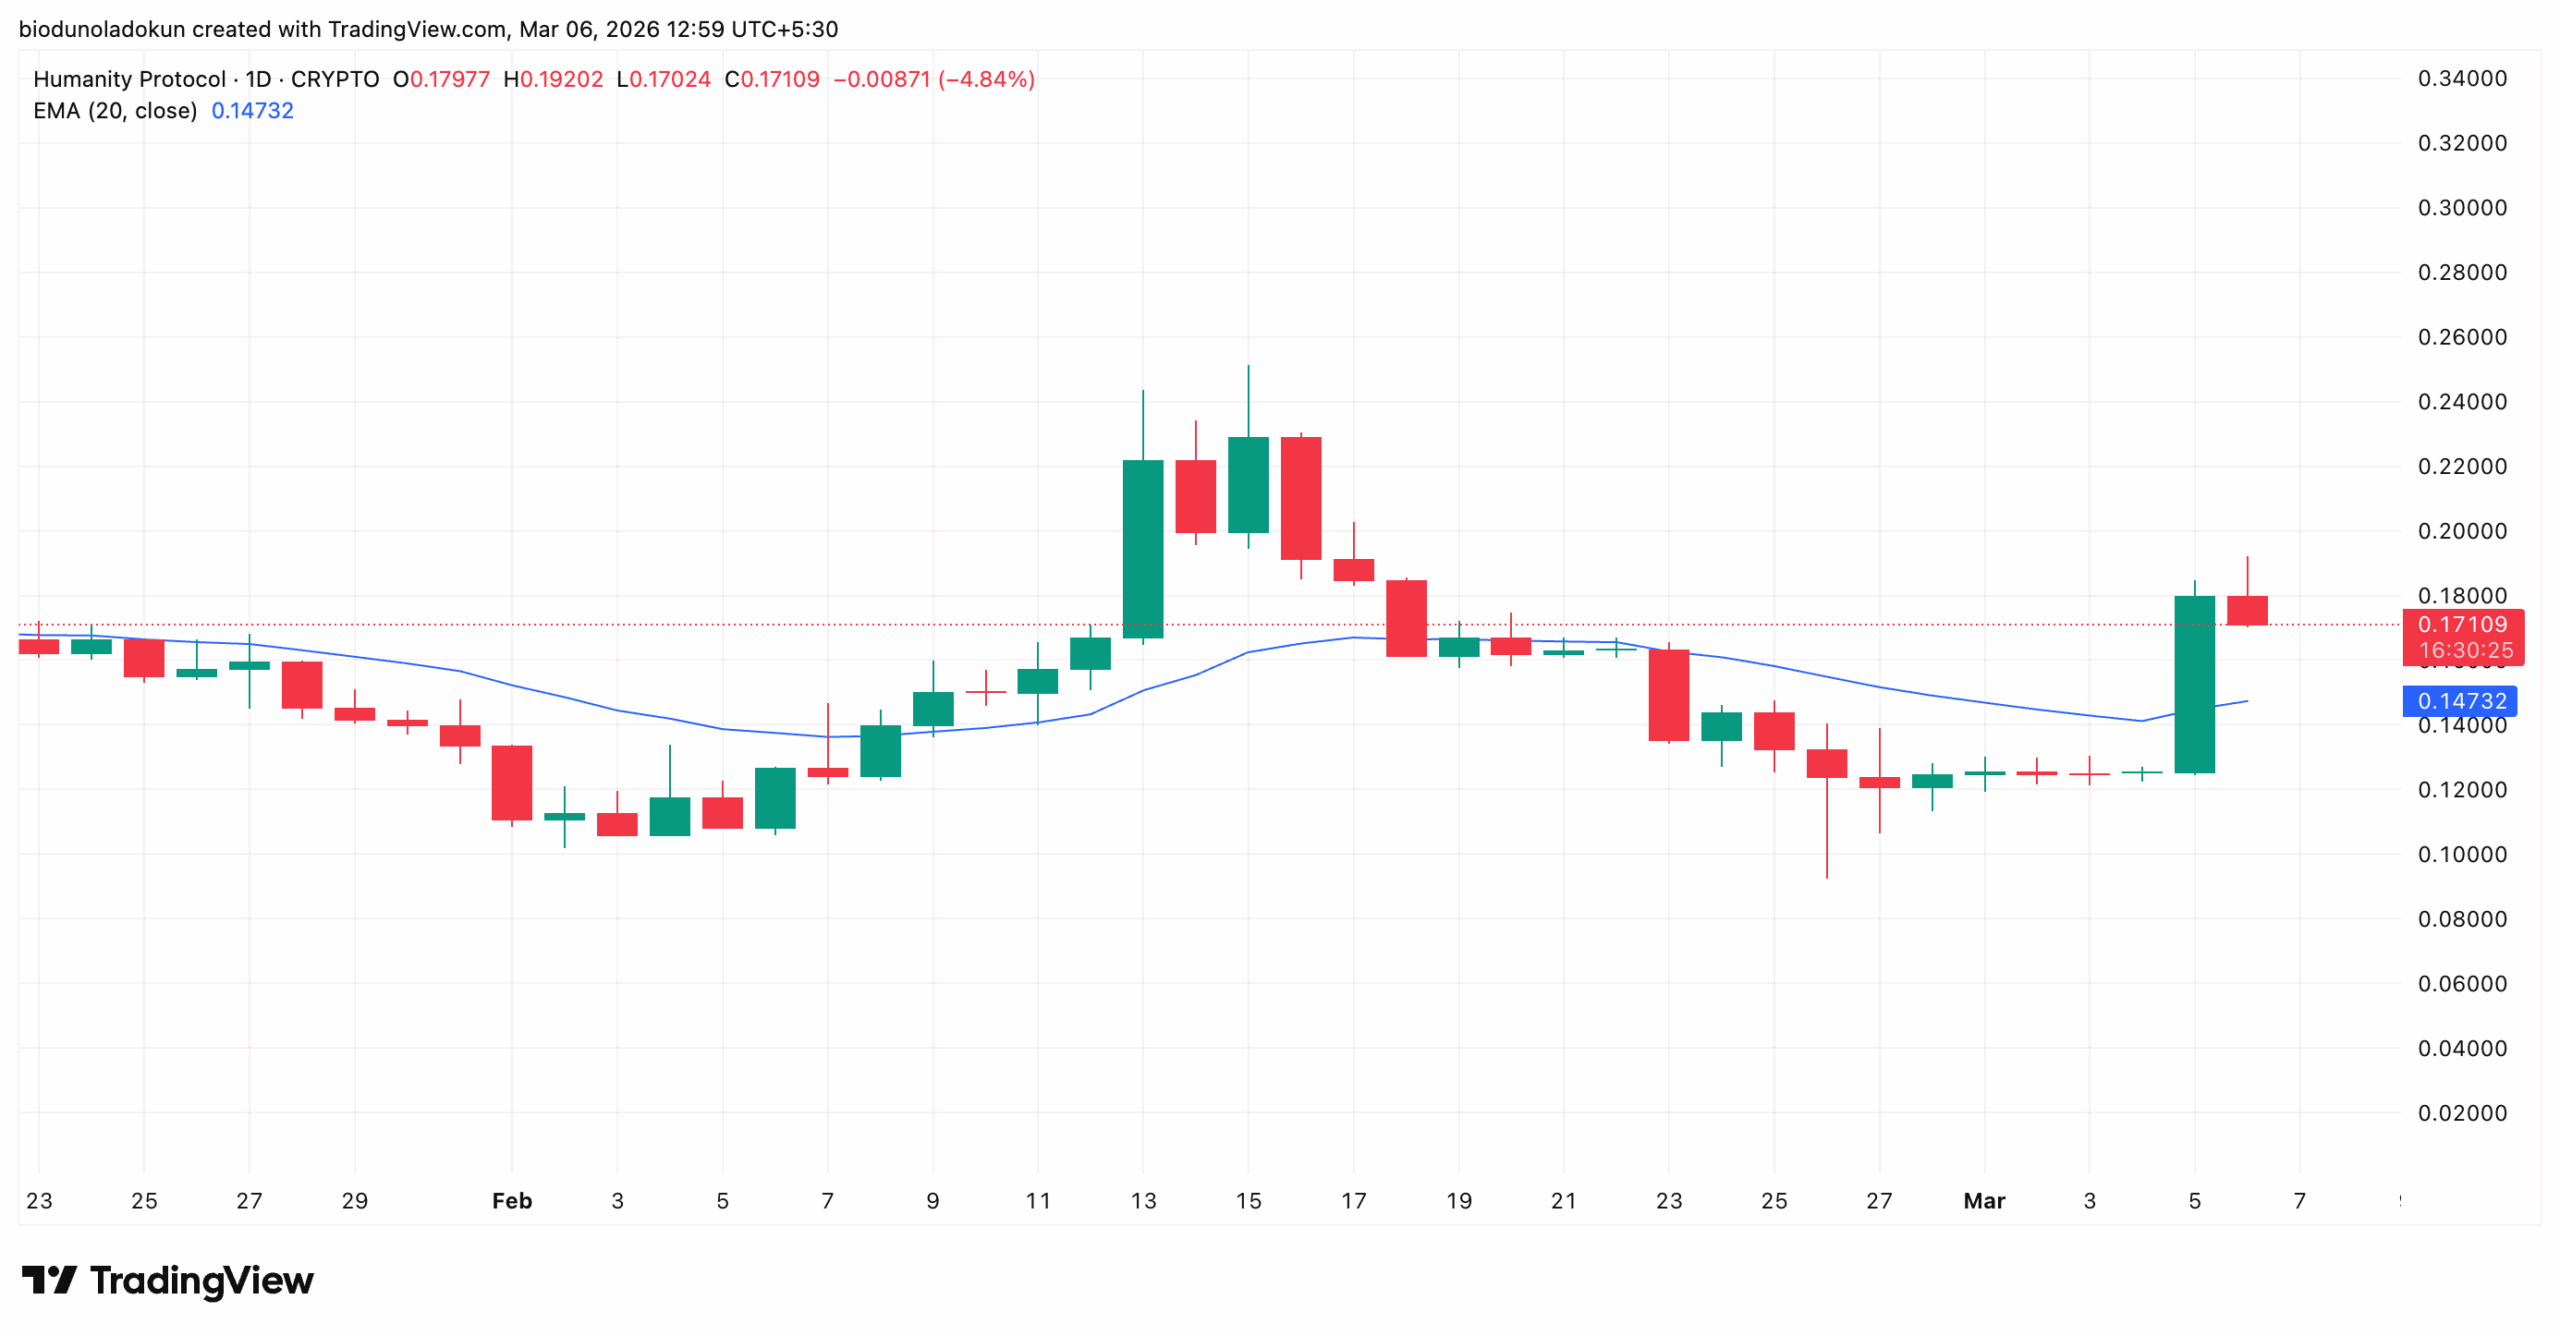
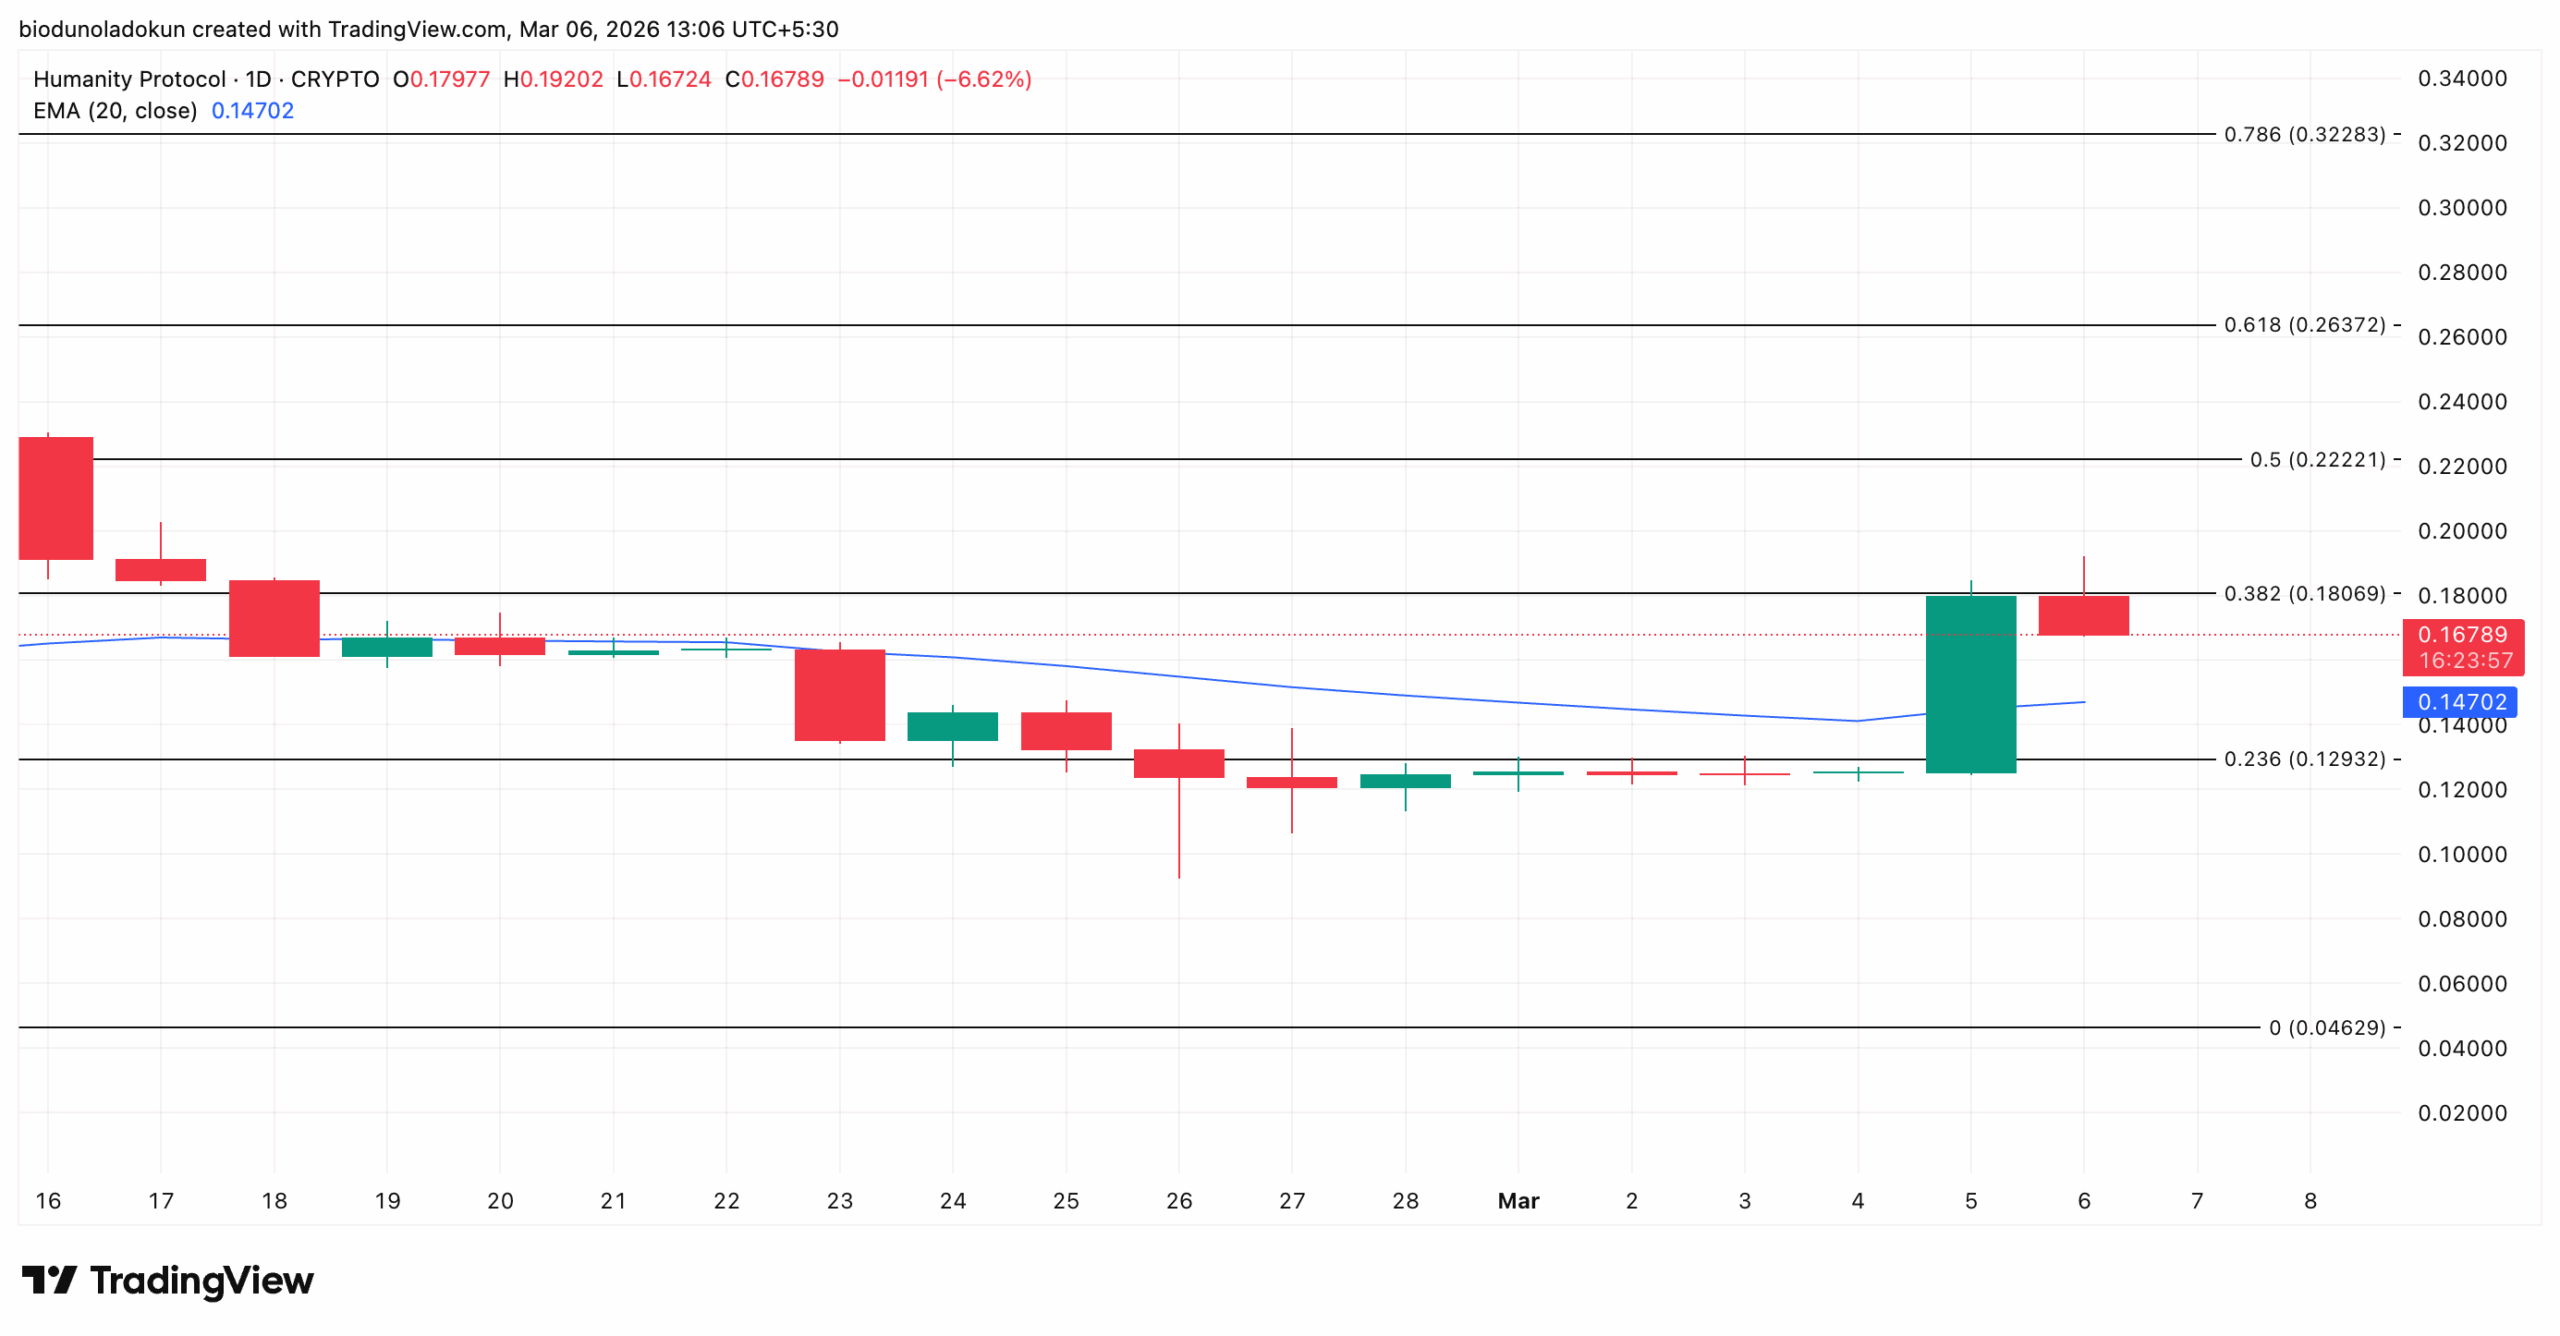
H’s 41% boom on Thursday pushed its price above the 20-day Exponential Moving Average (EMA), a position it still maintains as of this writing.
This move is notable because traders often use this indicator to gauge short-term trend direction. The 20-day EMA measures an asset’s average price over the past 20 trading days, giving recent prices greater weight.
A close above this level confirms a shift in momentum, suggesting that buyers are regaining control and could push H’s value higher if they maintain dominance.
Moreover, an assessment of the token’s Moving Average Convergence Divergence (MACD) setup supports the likelihood of a sustained rally.
The MACD indicator identifies trends and momentum in its price movement. It helps traders spot potential buy or sell signals through crossovers between the MACD and signal lines.
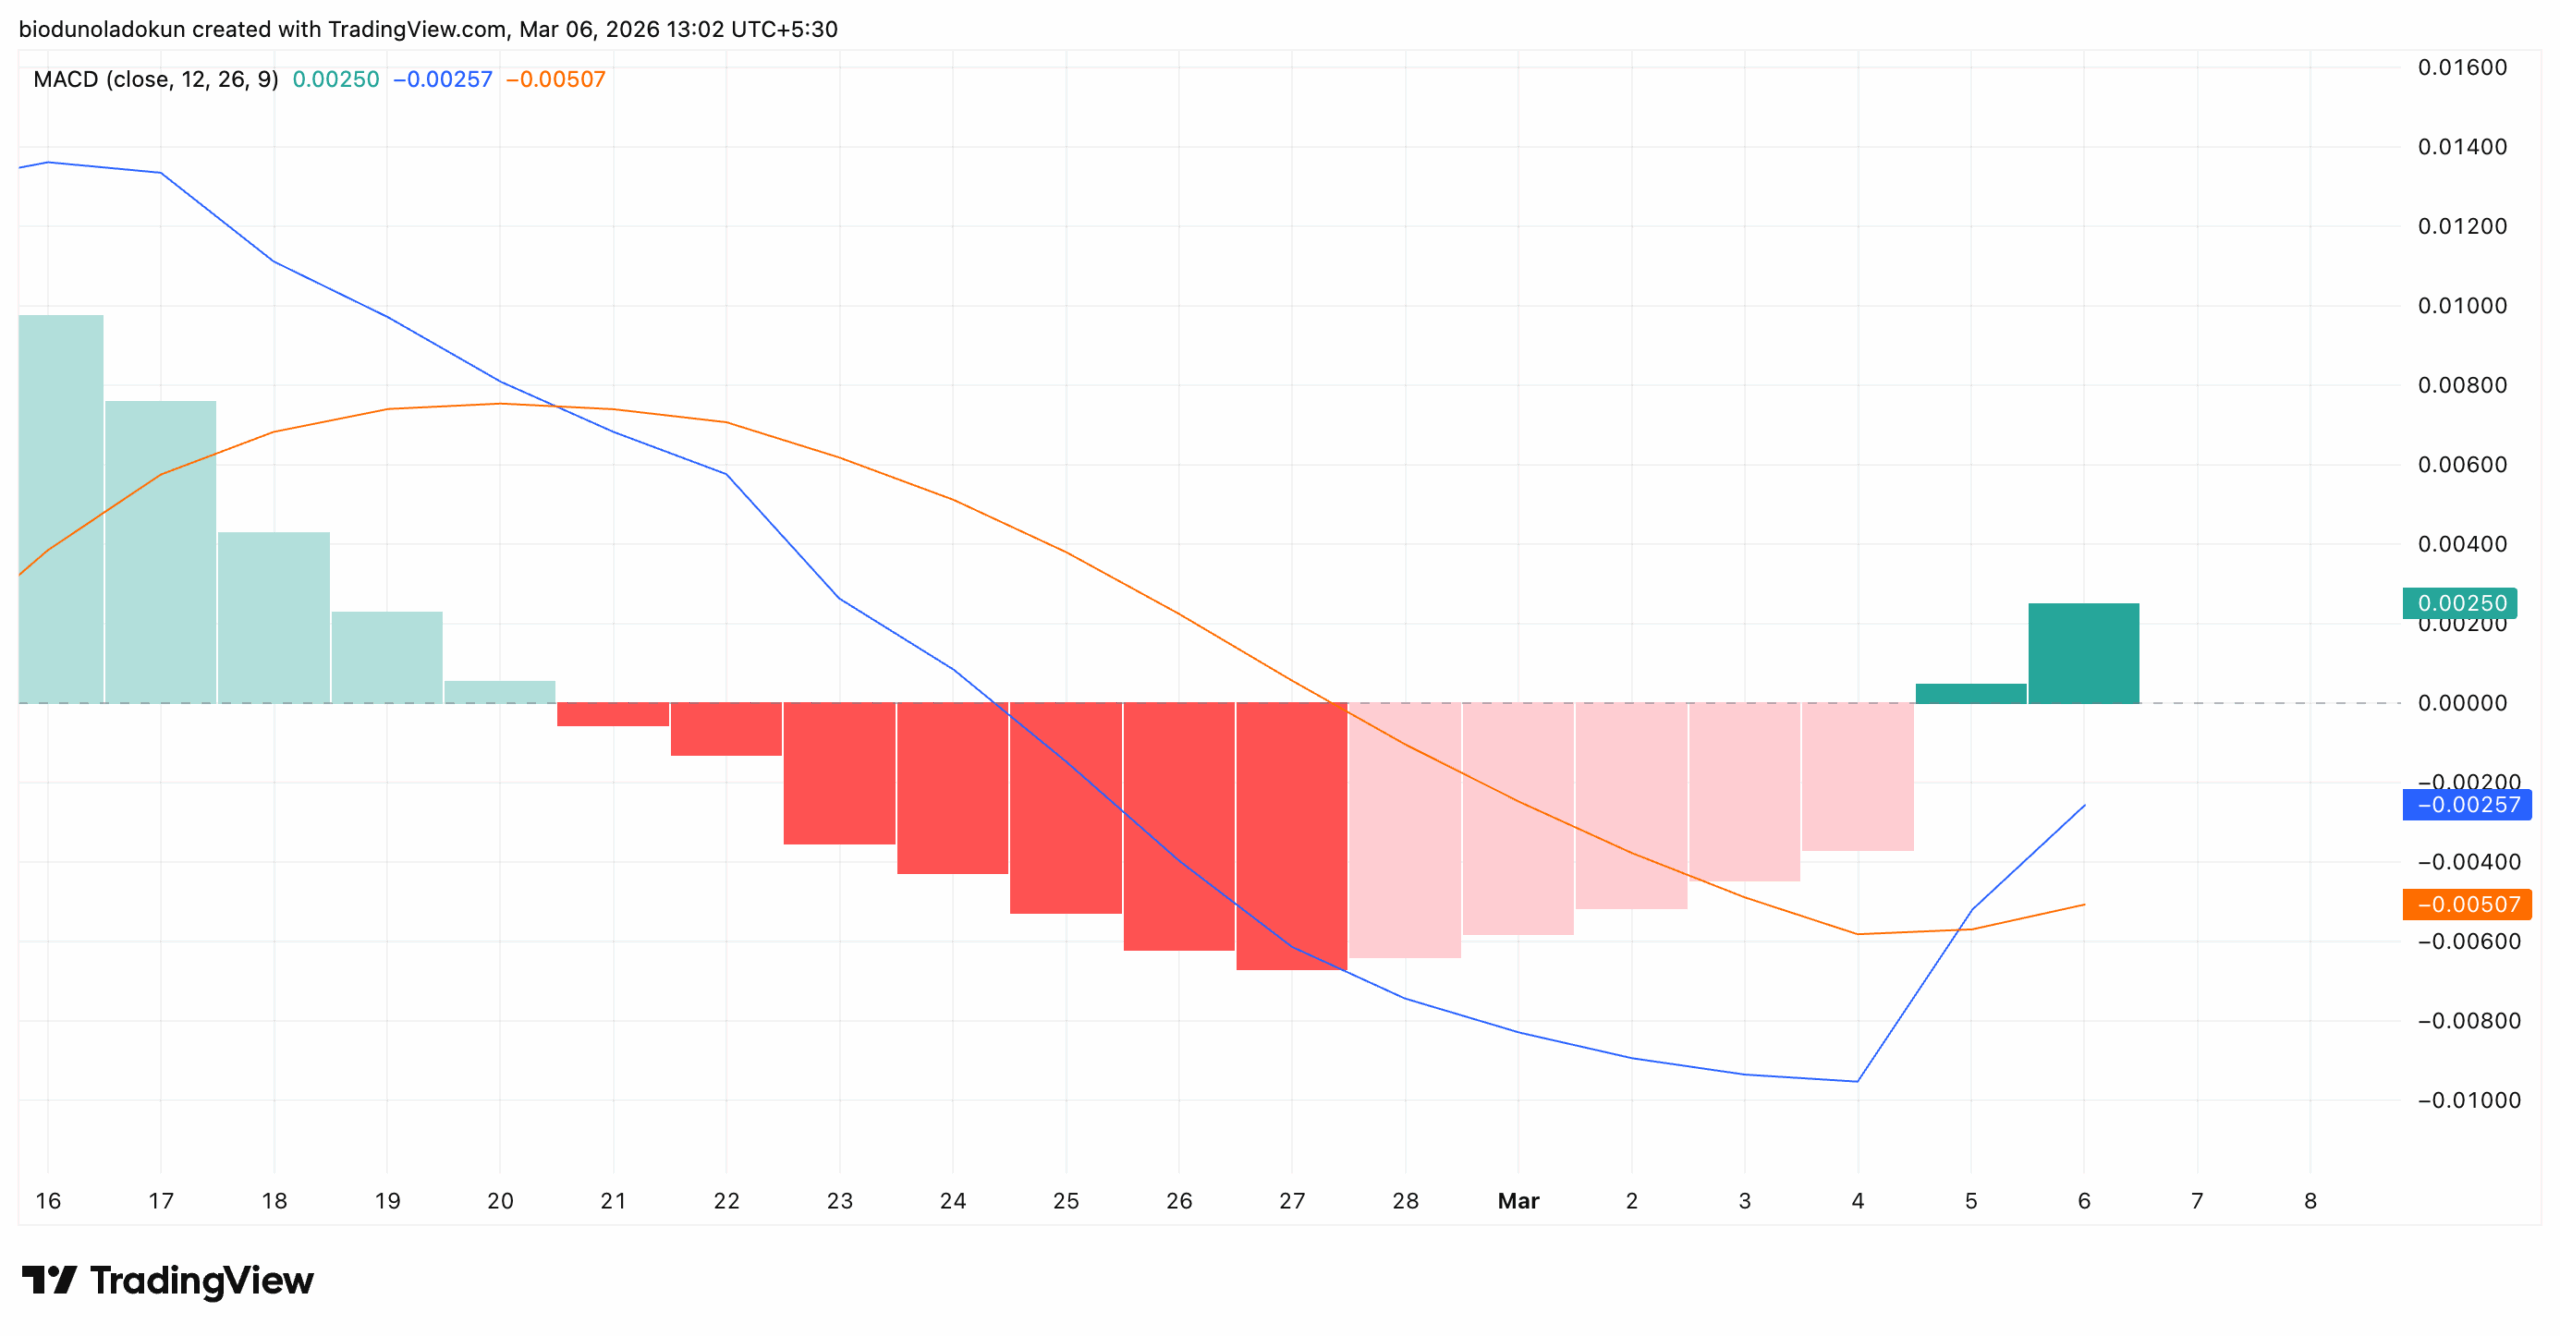
Readings from the daily chart show that the MACD line (blue) has crossed above the signal line (orange), a bullish crossover that typically signals a shift in momentum toward buyers.
This follows an extended stretch of red histogram bars that dominated the last half of February, showing the selling pressure H endured during that period.
The histogram has now flipped green, indicating that bullish momentum is beginning to build. However, it is worth noting that both the token’s MACD and signal lines remain below the zero line.
They must cross and hold above to fully confirm a bullish takeover and validate the case for a sustained rally.
H Bulls Take the Lead in Derivatives
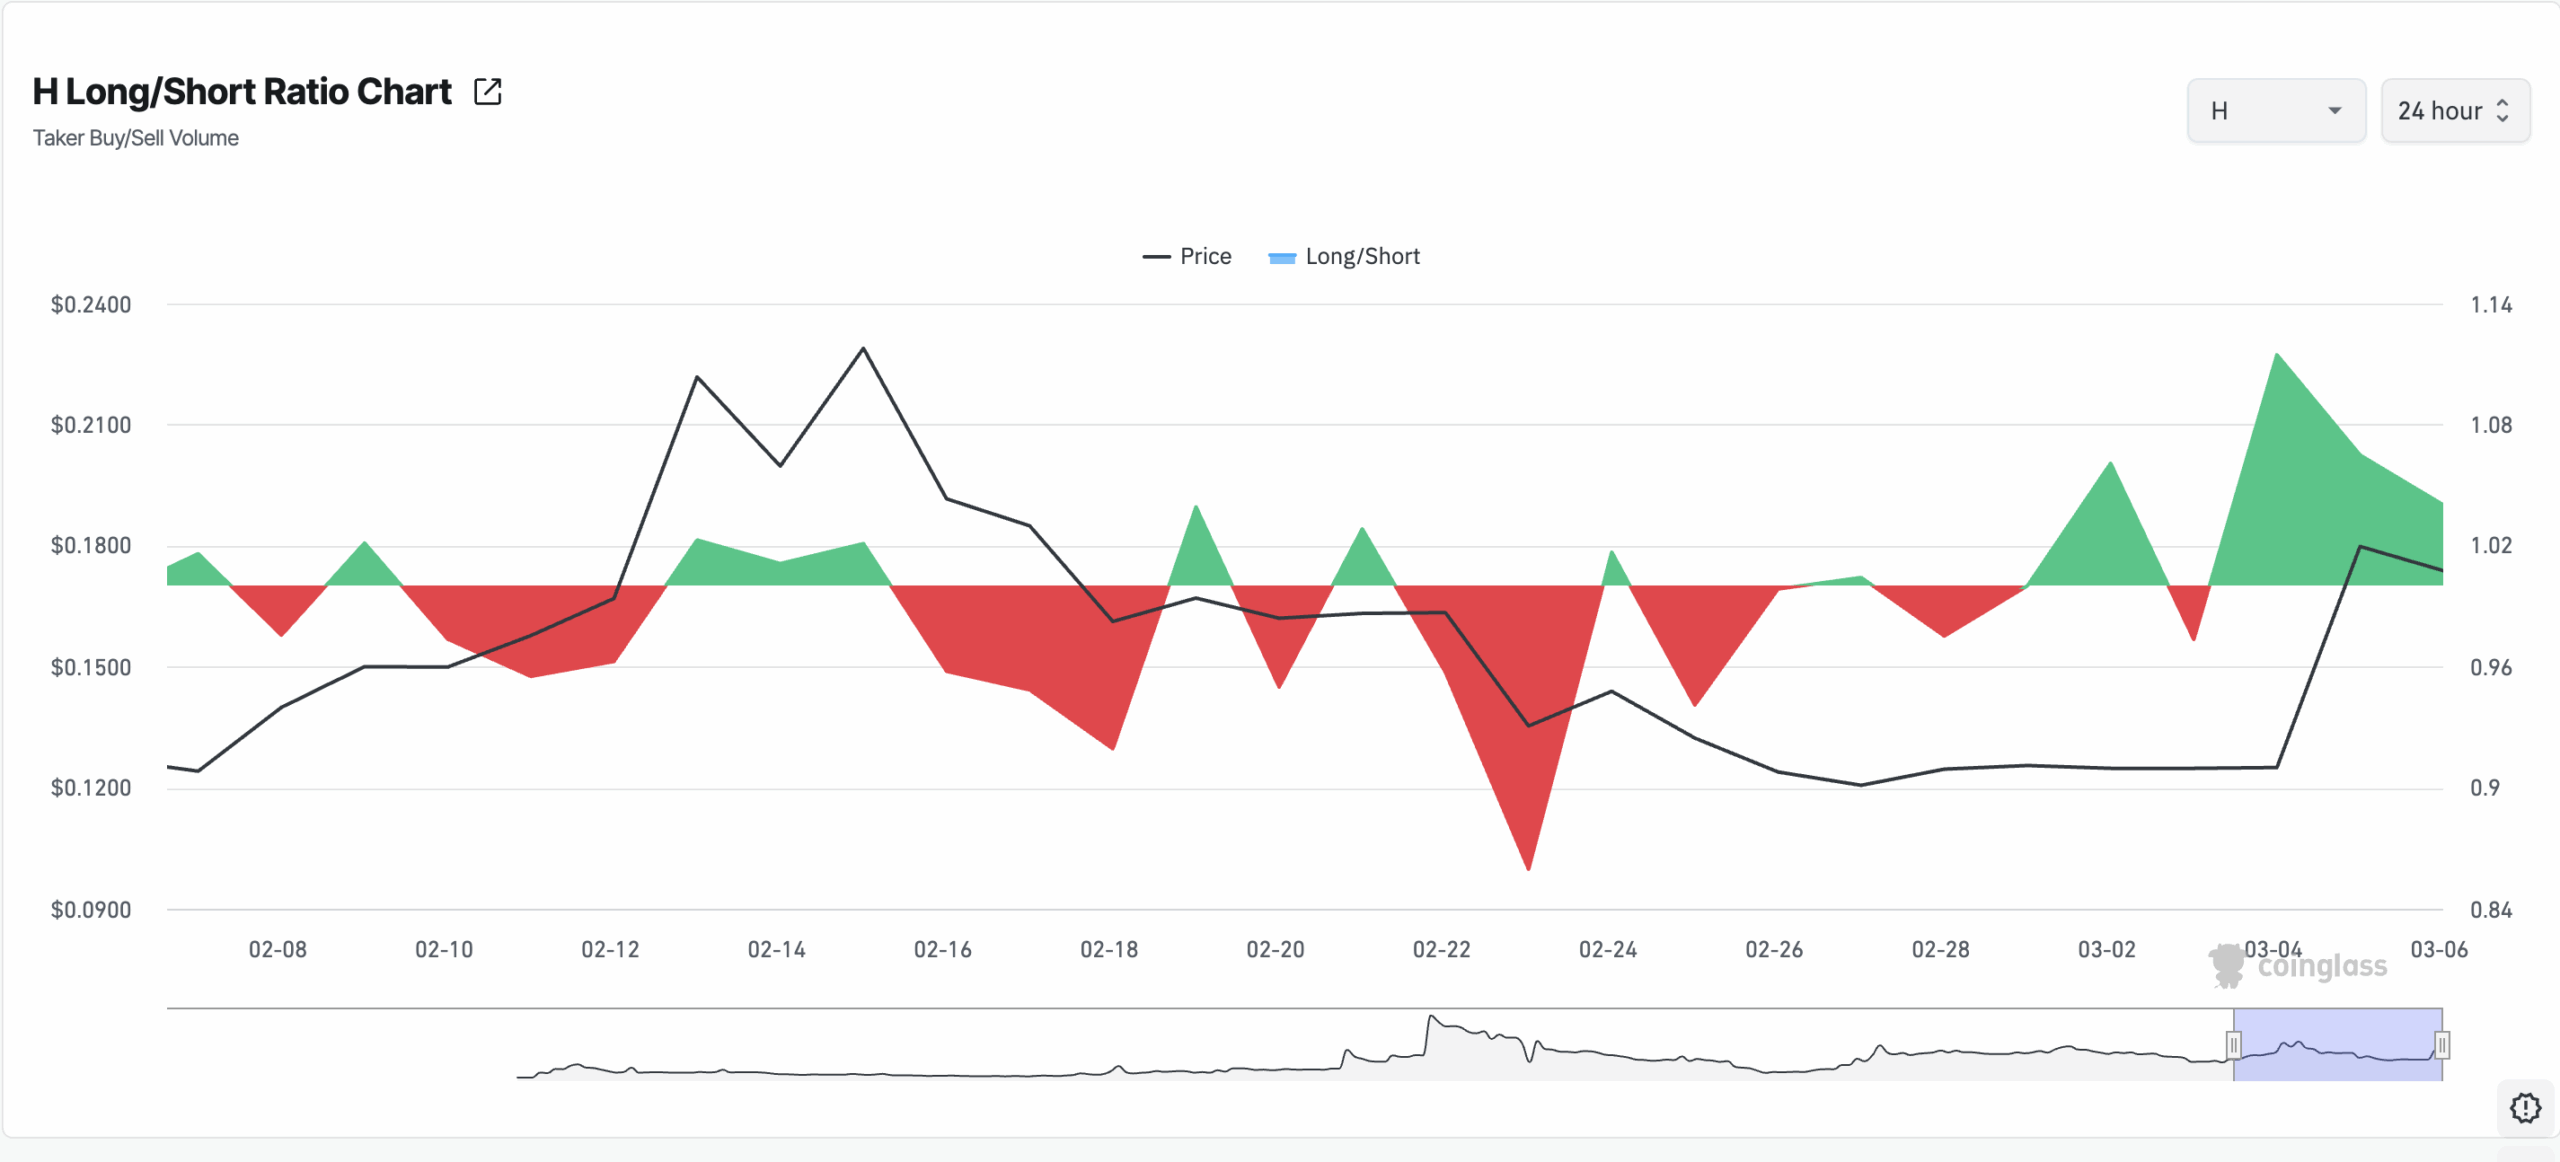
A look at activity in H’s derivatives market shows sentiment is tilting decisively toward long positions. According to Coinglass, the token’s Long/Short Ratio shows that the demand for longs has surged since March began.
For context, for most of February, short positions repeatedly overwhelmed longs. This is reflected in the extended stretches of red that culminated in H’s price falling to $0.1206 on February 27.
However, with market sentiment improving, H’s long/short ratio is 1.04 at press time. This indicates that a majority of traders with open positions are now positioned for further upside, a trend that can help push prices higher in the near term.
In this scenario, the Humanity Protocol token could extend its gains and push above its next resistance at $0.1806. A successful breach of this barrier could drive the altcoin to $0.222.
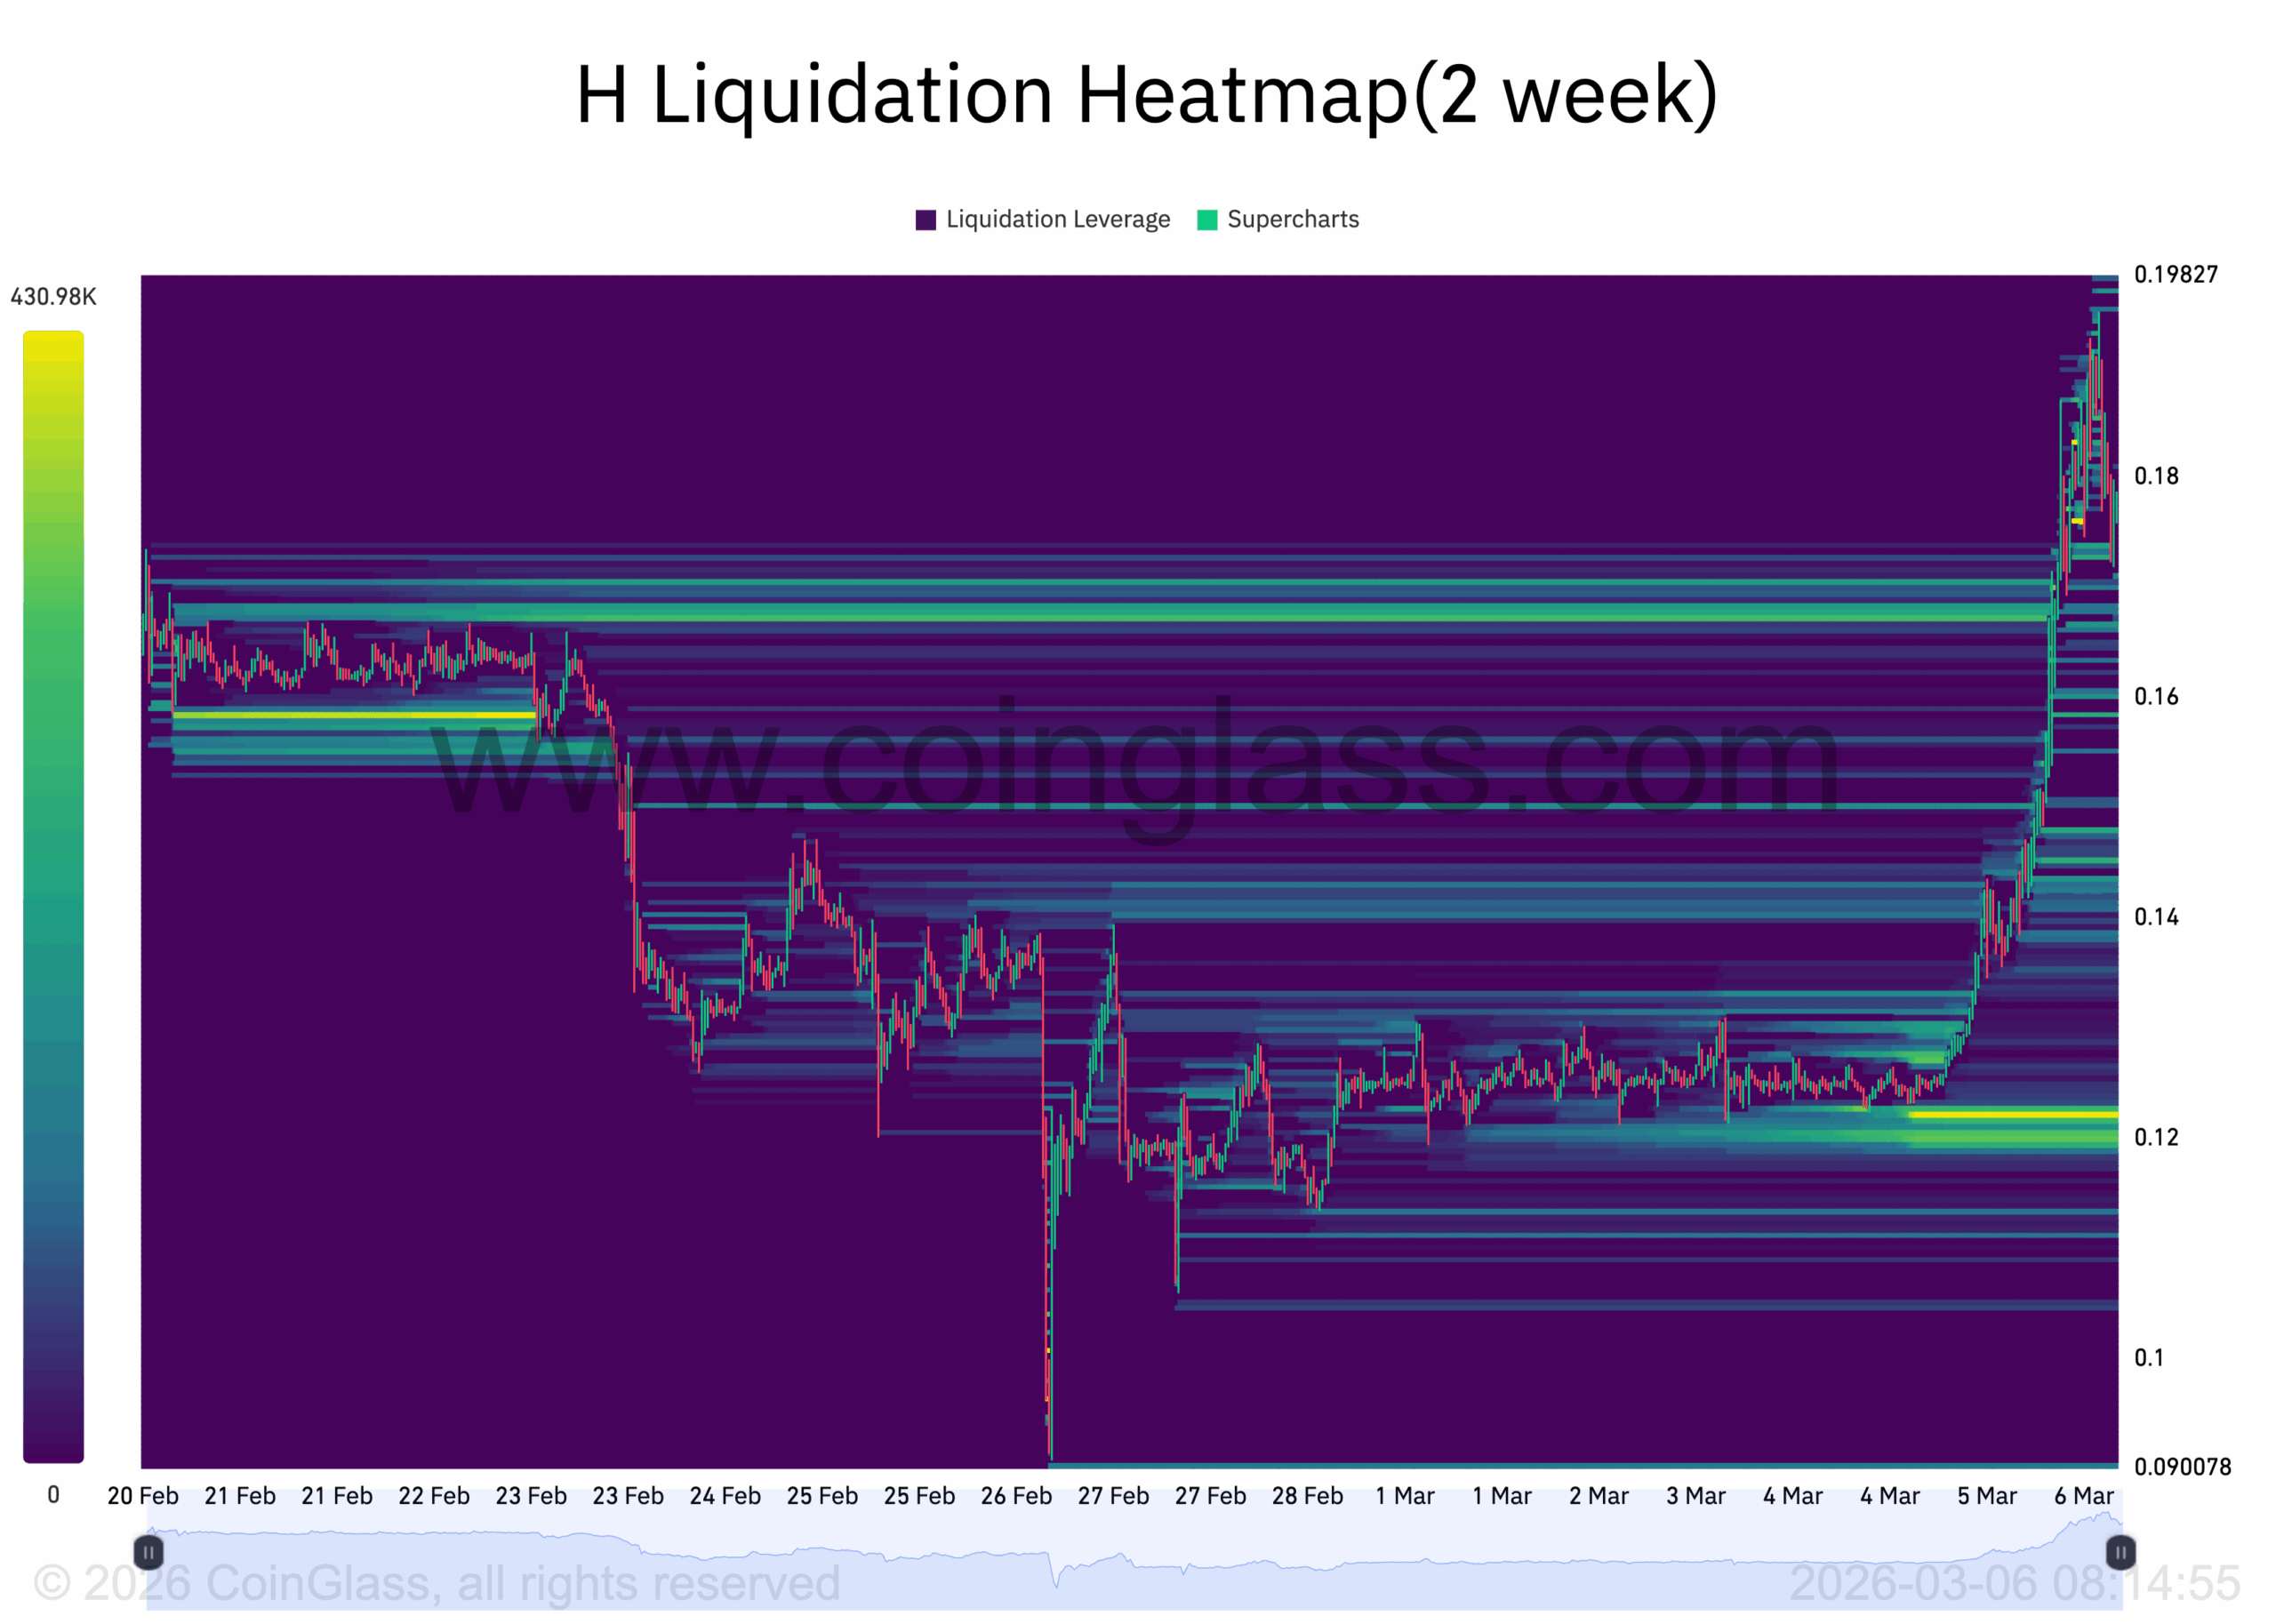
However, a liquidity cluster below H’s current value may invalidate this bullish outlook. Per Coinglass data, H’s liquidation heatmap shows a dense concentration of liquidity around $0.121.
This zone represents the heaviest buildup of leveraged positions within a two-week window and acts as a magnet that may draw prices toward it before any move higher.
Liquidation heatmaps are visual tools traders use to identify price levels where large clusters of leveraged positions are likely to be liquidated.
These maps highlight areas of high liquidity, often color-coded to indicate intensity, with brighter zones indicating greater liquidation potential.
Usually, these price zones act as magnets for price action, as the market tends to move toward these areas to trigger liquidations and open fresh positions.
If H faces a wave of profit-taking, the price could retrace toward that $0.121 liquidity cluster. Should that level fail to hold as support, a deeper correction toward $0.10 or lower is possible.
[You-may-like]
Disclaimer:
The information provided in this article is for informational purposes only. It is not intended to be, nor should it be construed as, financial advice. We do not make any warranties regarding the completeness, reliability, or accuracy of this information. All investments involve risk, and past performance does not guarantee future results. We recommend consulting a financial advisor before making any investment decisions.
Abiodun Oladokun is a Research Analyst at CCN, where he covers cryptocurrency markets with a focus on on-chain analysis, technical assessments, and emerging trends across decentralized finance (DeFi), real-world assets (RWA), artificial intelligence (AI), decentralized physical infrastructure networks (DePIN), Layer 2s, and meme coins.
Prior to CCN, he served as a Senior On-Chain Analyst at BeInCrypto, producing market reports spanning diverse crypto sectors.
Before that, he conducted technical analysis and market assessments of various altcoins at AMBCrypto, where he also contributed long-form quarterly research papers on DeFi, NFTs, DAOs, and scaling architectures, leveraging on-chain platforms including Messari, Santiment, DefiLlama, and Dune Analytics.
He began his crypto career as a research analyst at SixthSense DAO, developing blockchain forensic tools to trace the history of stolen assets.
Abiodun is a lawyer called to the Nigerian Bar and the founder of Ilé Ijó, a Lagos-based electronic dance music collective.