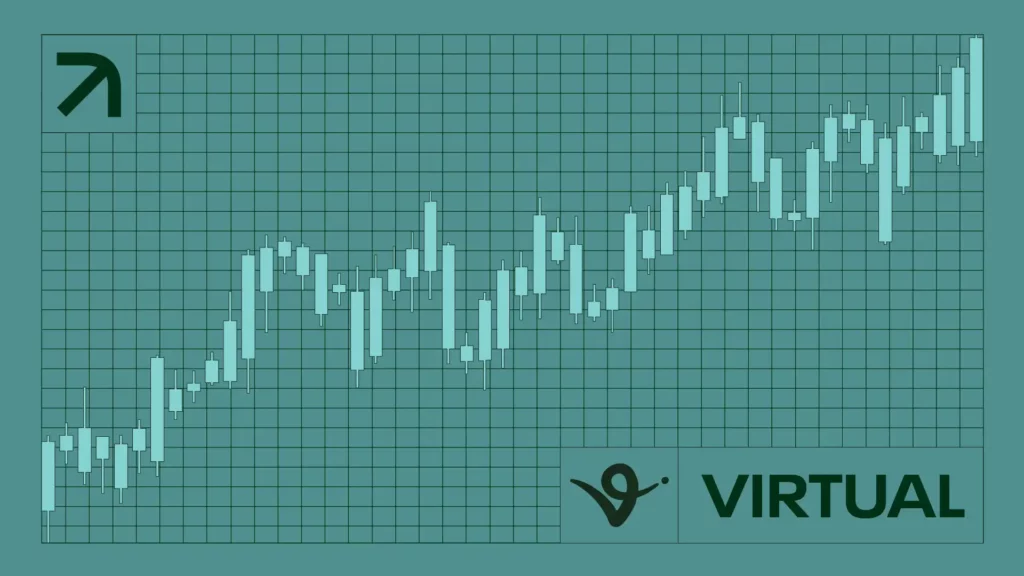
VIRTUAL sees steep 55% drop after record surge. Credit: Hameem Sarwar
Share
Key Takeaways
VIRTUAL dropped 55% from its all-time high.
The price could have finished a five-wave upward cycle.
Key support levels are crucial to halt further decline and stabilize the price.
Virtuals Protocol (VIRTUAL) kicked off 2024 with an extraordinary rally, surging over 2,700% to reach an all-time high of $5.14 on Jan. 2, solidifying its position as one of the year’s standout performers.
However, 2025 has brought a stark reversal, with the price plunging 55% from its peak. Long-term indicators also show bearish divergences, signaling that the bullish momentum may have run its course.
Is a VIRTUAL recovery still possible, or is the price poised for further decline this year? Let’s take a closer look.
Reasons Behind VIRTUAL’s Fall
The VIRTUAL price increased by nearly 27,000% since July 2024 while suffering minimal pullbacks. The rally became completely parabolic in November, and the price reached a new all-time high of $5.14 in the first week of January 2025.
However, things have turned sour since. After its all-time high, VIRTUAL fell to a low of $2.31, losing over half its value. The next closest support is at $1.60, so it may be a while before VIRTUAL can halt its decline.
The wave count also shows a completed five-wave increase (white) since July 2024. If the count is accurate, VIRTUAL has begun its lengthy correction.
Finally, the Relative Strength Index (RSI) and Moving Average Convergence/Divergence (MACD) also suggest the price has reached its cycle high. The RSI generated a bearish divergence in overbought territory, while the MACD made a bearish cross for the first time.
So, the VIRTUAL price may have completed its bullish cycle and started a lengthy bearish trend.
Further Downside Ahead
The short-term outlook does not offer any hope for relief. On the contrary, VIRTUAL has broken down from a descending parallel channel that had contained the correction since the all-time high. The downward movement has become sharper since the breakdown.
While there is minor support at $2.05, neither the RSI nor MACD have generated any bullish divergences. On the contrary, both are falling, suggesting bears are in control, and the price will continue falling for the time being.
Because of the bearish readings and lack of support, VIRTUAL could fall to $1.60 without experiencing any significant bounces.
Bearish 2025 for VIRTUAL
While the VIRTUAL price was one of the best performers in the second half of 2024, its fortunes have turned in 2025. VIRTUAL may have reached its cycle high and could be corrected for the first half of 2025.
Disclaimer:
The information provided in this article is for informational purposes only. It is not intended to be, nor should it be construed as, financial advice. We do not make any warranties regarding the completeness, reliability, or accuracy of this information. All investments involve risk, and past performance does not guarantee future results. We recommend consulting a financial advisor before making any investment decisions.
Valdrin Tahiri is a cryptocurrency analyst and reporter at CCN, specializing in technical analysis with a focus on Elliott Wave theory, on-chain metrics, and fundamental research. He brings over seven years of experience in the crypto space as both a trader and writer.
He discovered cryptocurrencies in 2017 while earning his MSc in Financial Markets at the Barcelona School of Economics, which sparked a deep interest in blockchain and market dynamics. Since then, he’s contributed to top crypto outlets like BeInCrypto and CoinGape.
Valdrin also served as Community Manager of BeInCrypto’s Telegram group for three years, helping grow it into one of the largest crypto communities worldwide. His expertise in market structure and price patterns allows him to break down complex trends into clear, actionable insights.
He’s published thousands of articles covering altcoins, Bitcoin cycles, and macro trends.