Here's Why TRX Could Reach New Highs Soon | Credit: Derek Fenech
Share
Key Takeaways
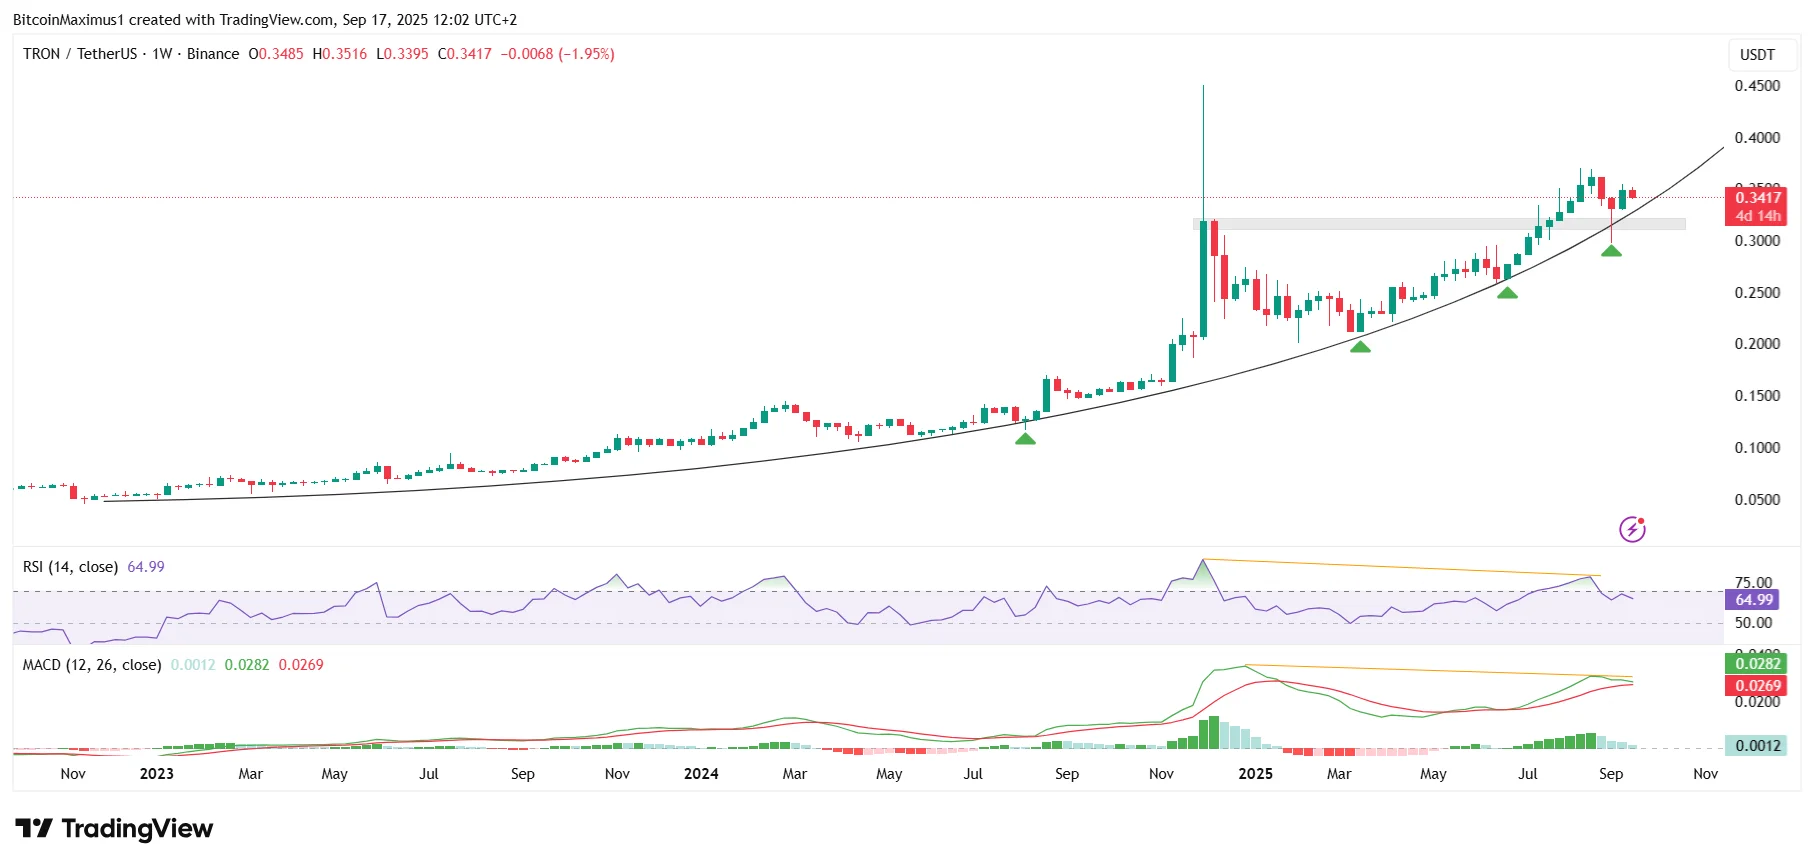
TRON (TRX) follows a parabolic ascending support trend line.
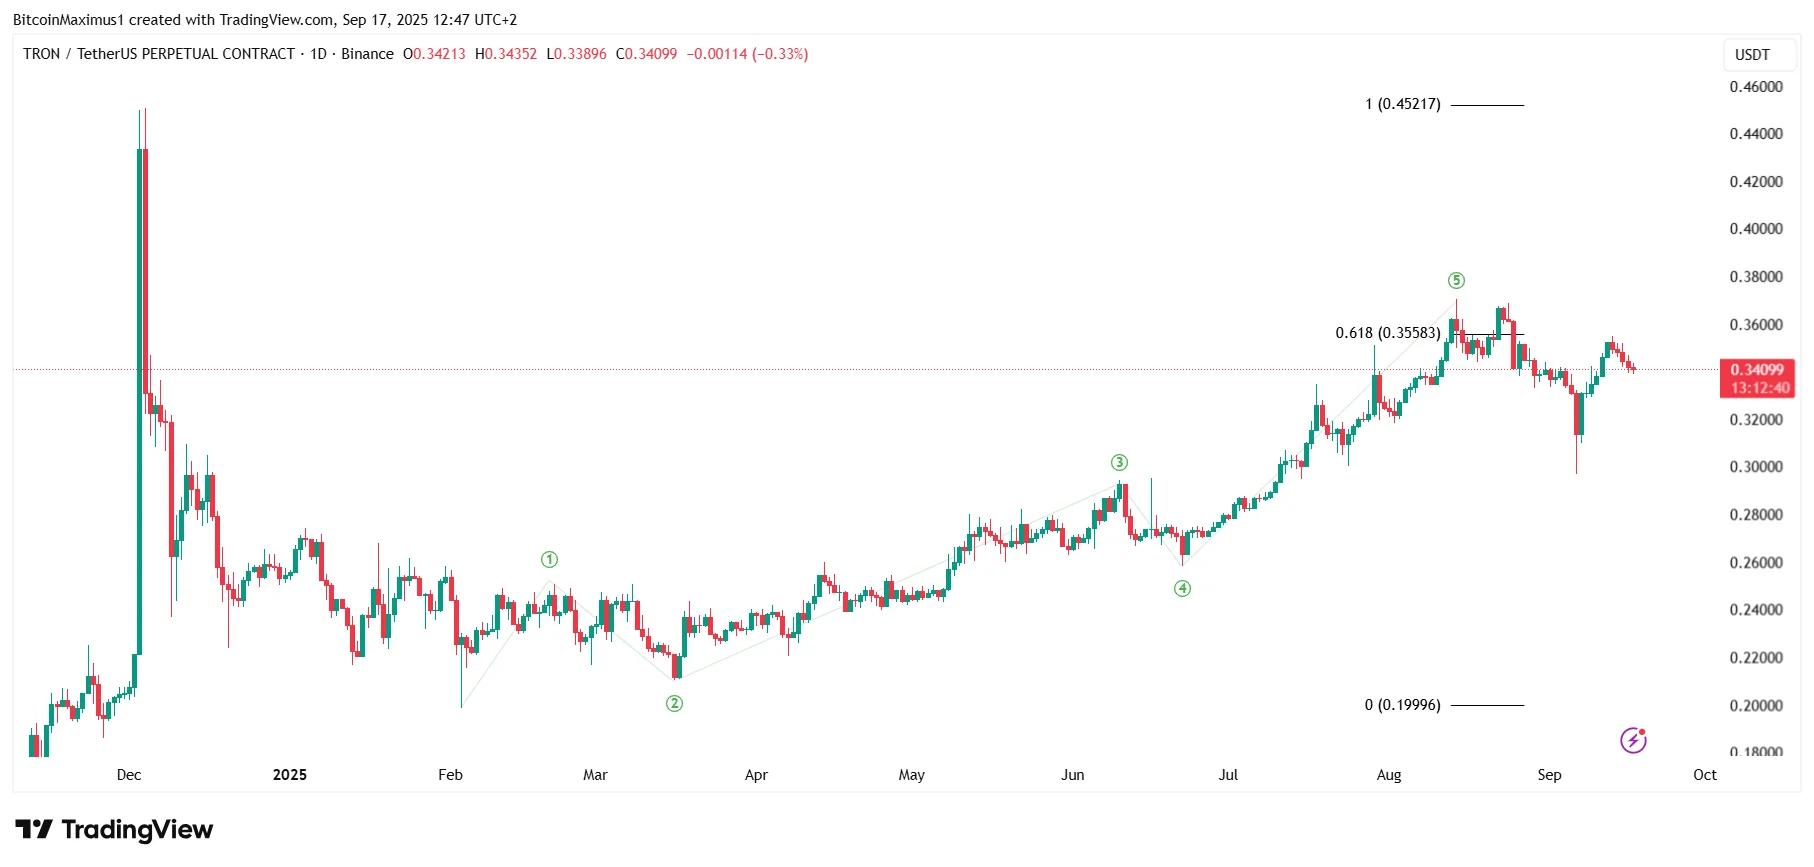
The TRX price is in the fifth and final wave of its upward movement.
Will TRX reach a new all-time high in 2025, or is the cycle top already in?
TRON (TRX) has been one of the most resilient altcoins throughout the recent market cycle.
It sustained its momentum by creating several higher lows along its parabolic trend.
While bulls have defended the key levels, most recently preventing a breakdown in September, it is unclear if they have the upper hand.
The big question now is: Will TRX reach a new all-time high in 2025, or has the cycle already peaked?
TRX Price Analysis
The weekly time frame chart shows that TRX has increased alongside a parabolic ascending support trend line since November 2022.
TRX has bounced at this trend line several times (green icons), most recently in September (green icon).
Get These Top Crypto Casino Offers Now!
Sponsored
Disclosure
We sometimes use affiliate links in our content, when clicking on those we might receive a commission at no extra cost to you. By using this website you agree to our terms and conditions and privacy policy.
Momentum indicators are showing weakness. The Relative Strength Index (RSI) and Moving Average Convergence/Divergence (MACD) have generated bearish divergences.
Additionally, the RSI fell below 70, while the MACD nearly made a bearish cross.
So, on one hand, the price action clearly shows a bullish trend with several higher lows.
On the other hand, momentum indicators are showing weakness, hinting at a possible local top ahead.
Therefore, the TRX price prediction is unclear based on the weekly time frame readings alone.
What’s Next for TRX?
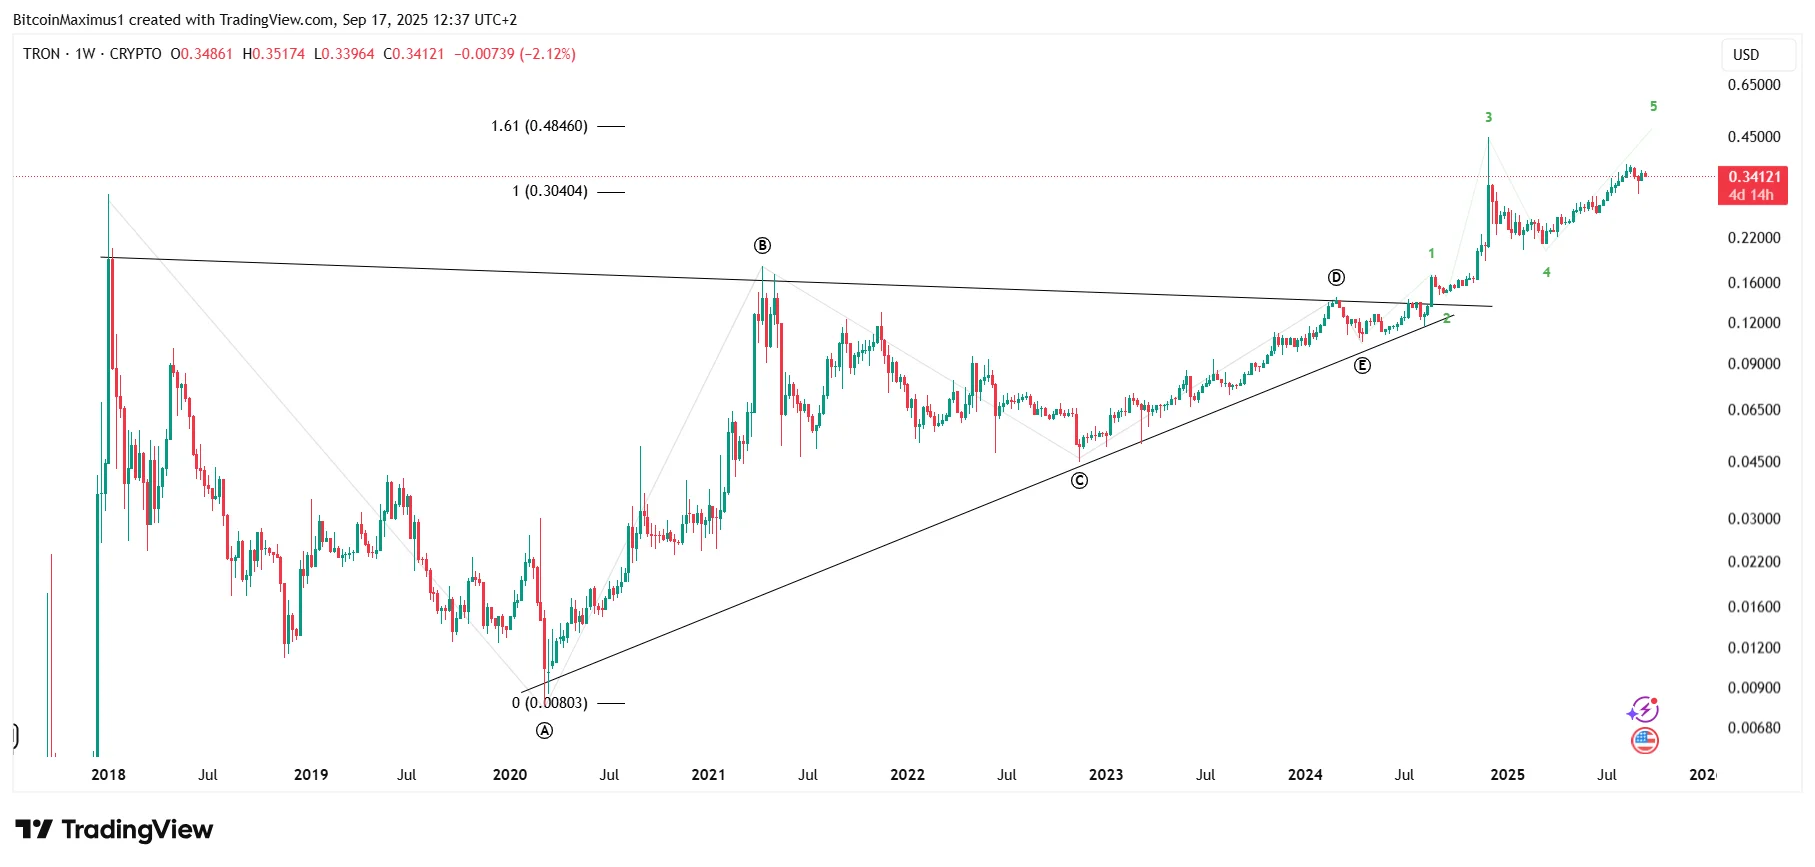
TRON’s wave count is irregular, but still fits Elliott Wave rules quite well.
According to the count, TRX completed a long-term triangle correction with a breakout in April 2024.
Since then, it has finished a five-wave upward movement (green) and is in its final portion.
While the wave count predicts a new all-time high, there is a worrisome development regarding it.
Valdrin Tahiri is a cryptocurrency analyst and reporter at CCN, specializing in technical analysis with a focus on Elliott Wave theory, on-chain metrics, and fundamental research. He brings over seven years of experience in the crypto space as both a trader and writer.
He discovered cryptocurrencies in 2017 while earning his MSc in Financial Markets at the Barcelona School of Economics, which sparked a deep interest in blockchain and market dynamics. Since then, he’s contributed to top crypto outlets like BeInCrypto and CoinGape.
Valdrin also served as Community Manager of BeInCrypto’s Telegram group for three years, helping grow it into one of the largest crypto communities worldwide. His expertise in market structure and price patterns allows him to break down complex trends into clear, actionable insights.
He’s published thousands of articles covering altcoins, Bitcoin cycles, and macro trends.