Sonic could be primed for an extended rally beyond the current levels | Credit: Hameem Sarwar
Share
Key Takeaways
Sonic price has broken above the upper trendline of a falling wedge, resulting in a 24-hour 8% hike.
Support at $0.45 reveals that the S token price will likely rise beyond the resistance level at $0.58.
With rising buying pressure and bullish momentum, Sonic’s value might rally to the 0.786 Fib level.
On Jan. 22, Sonic (S) ‘s price was $0.65, hinting at a sustained rally toward $1. By Jan. 28, the price had fallen to $0.44, fueling speculation of further downside.
However, in the last 24 hours, S has become one of the top gainers out of the top 100 cryptos. In the process, the Sonic price has reclaimed $0.50 — a crucial support zone.
After retesting $0.50, it seems that the token could extend this gain with market conditions showing signs of improvement and a bullish technical setup. Will buyers capitalize on this breakout and drive the price higher?
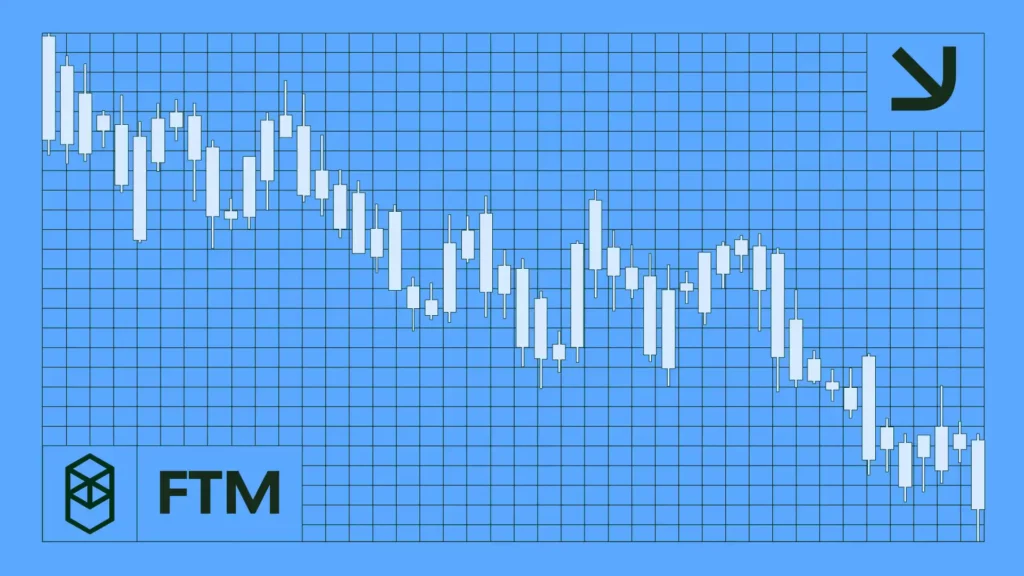
On the 4-hour chart, the price decrease from $0.65 to $0.44 formed a falling wedge. A falling wedge is a pattern that forms when two descending trendlines connect a series of lower highs and lower lows.
This pattern indicates a potential bullish reversal as the price consolidates within a narrowing range. According to the image below, Sonic’s price has broken above the previous range-bound movement, indicating the bullish breakout has been confirmed.
Furthermore, the Relative Strength Index (RSI) has risen above the neutral midpoint, indicating that the momentum around Sonic is bullish. Like the RSI, the Chaikin Money Flow (CMF) reading has also increased.
The rise in the CMF reading indicates increasing accumulation, which can be a prerequisite for an extended price increase. If these indicators continue to see higher ratings, then the S price might follow suit and trade higher than $0.50.
From an on-chain perspective, the In/Out of Money Around Price (IOMAP) shows strong support for S, previously FTM, at around $0.45.
At this price, 1,660 addresses accumulated over 650 million tokens. This volume, which is in profit, is higher than the token purchased between $0.51 and $0.58, which is currently in unrealized losses.
S In/Out of Money Around Price | Credit: IntoTheBlock
Typically, the higher the volume of unrealized profits, the stronger the support. Also, the higher the volume of losses, the stronger the resistance. Therefore, with strong support at $0.45, Sonic’s price will likely rise above $0.58 in the short term.
S Price Prediction: Why $0.76 Could Be the Next Target
Another look at the 4-hour chart confirms the support for the S token. Specifically, the dots of the Parabolic Stop And Reverse (SAR), is below the $0.50.
When the dots flip the price, it indicates a bearish reversal. But since it is below it, it means that the S price might continue to trade in the same direction, indicating strong support for the token.
Should the Parabolic SAR remain below the cryptocurrency’s value, then Sonic’s price could rise above the 0.236 Fibonacci retracement at $0.53.
If confirmed, Sonic’s price might rally by another 50%. It might climb to $0.76 in that scenario, positioned at the 0.786 Fib level.
Disclaimer:
The information provided in this article is for informational purposes only. It is not intended to be, nor should it be construed as, financial advice. We do not make any warranties regarding the completeness, reliability, or accuracy of this information. All investments involve risk, and past performance does not guarantee future results. We recommend consulting a financial advisor before making any investment decisions.
Victor Olanrewaju is a crypto analyst and reporter at CCN with deep roots in on-chain research and technical analysis. His crypto journey began in 2017, but it was the 2020 Uniswap airdrop that sparked a full-time pivot into the space.
With a foundation in copywriting, Victor honed his craft creating high-converting content for leading crypto brokers — most notably an XRP price prediction that ranked #1 on Google during the 2021 bull run.
He later joined AMBCrypto in 2022, where he combined storytelling with technical and on-chain analysis to cover key market narratives.
In 2024, he expanded his expertise at BeInCrypto, collaborating with analysts and using tools like Glassnode, Santiment, and IntoTheBlock to break down Bitcoin and altcoin trends.
At CCN, Victor covers the top cryptocurrencies, memecoins, macro shifts, blending real-time insights with deep-dive metrics.
He holds a Bachelor’s degree in Physics from the University of Ibadan, equipping him to simplify complex data for a wide audience. Follow his work or connect on LinkedIn or X.