SOL price still trades in a descending channel after recent rejection at its resistance. Will another leg down follow?
Share
Key Takeaways
SOL consolidates within a descending channel below $230.
Watch for a bounce near $209.93 and $176.47.
Breakout above $230 could resume the rally toward $264.10.
Solana (SOL) is currently in a Wave iv correction after a strong impulsive rally that peaked at $264.10. The price consolidates within a descending channel while testing key Fibonacci retracement levels, with support zones and resistance levels shaping the next potential move for bullish continuation or further correction.
The SOL daily chart shows a strong impulsive rally, forming a clear 5-wave structure before entering a correction phase.
SOL peaked at $264.10 (Wave iii) and is currently in Wave iv, consolidating within a descending channel while testing the 0.236 Fibonacci retracement at $220.
SOLUSD in a descending channel | Credit: Nikola Lazic/TradingView
Key support lies at the 0.382 Fibonacci level ($209.93) and the critical 0.618 retracement ($176.47), where a bounce could occur if selling pressure continues.
The chart also highlights previous resistance zones at $173.42, which are now serving as potential support. A break below this region may extend the correction further.
The Relative Strength Index (RSI) shows a gradual decline, reflecting weakening momentum during the correction phase.
SOL needs a breakout above the descending channel and the $236 resistance for bullish continuation. If successful, this move could resume the rally toward the previous high of $264 and potentially higher targets.
Key Observations
Wave iv Correction: SOL is consolidating within a descending channel.
Bullish Continuation: Breakout above $236 can resume upward momentum.
RSI Insight: Declining RSI reflects weakening momentum during consolidation.
SOL Price Prediction
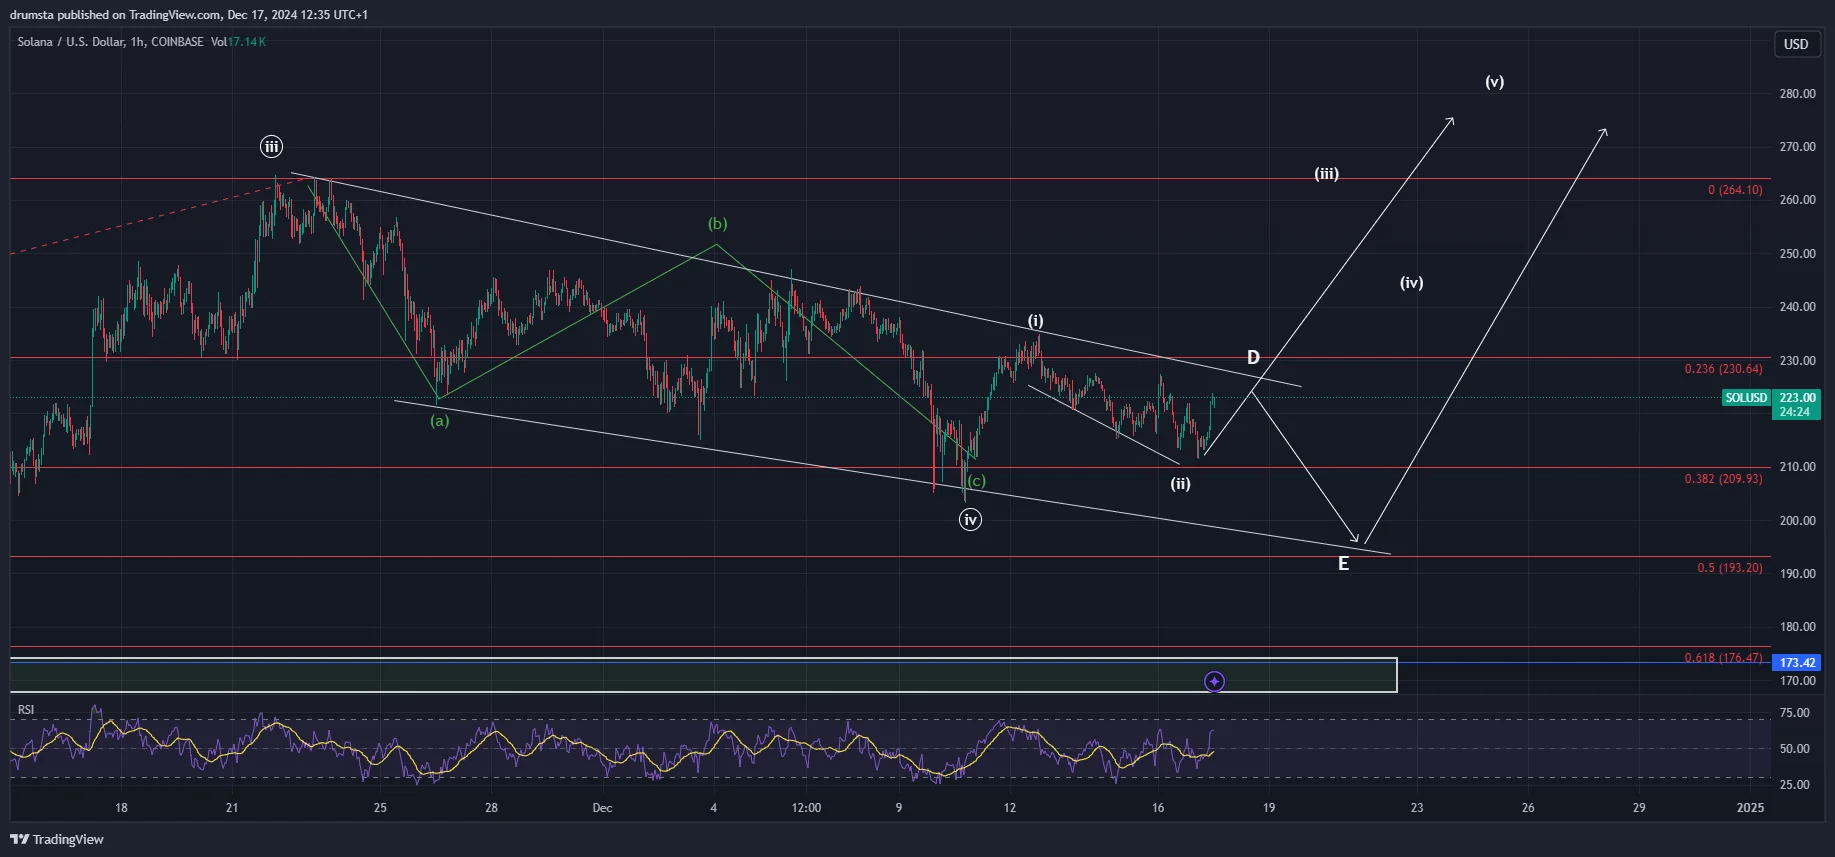
The SOL hourly chart shows a potential wave iv correction unfolding as a descending channel. The price is approaching the upper boundary near $230.64 (0.236 Fib level), which could act as resistance.
A rejection here might lead to another drop toward the lower boundary near $200 (0.382 Fib level).
SOLUSD another resistance interaction awaited | Credit: Nikola Lazic/TradingView
This pattern suggests a possible continuation of the correction phase, with Wave E likely targeting support at $193.20 (0.5 Fib) or $176.47 (0.618 Fib) before a reversal occurs.
If buyers reclaim momentum, a breakout above $230 could signal Wave v’s beginning, targeting the previous high at $264.10.
The RSI shows recovery from oversold conditions, indicating a potential short-term bounce. To confirm bullish continuation, SOL must break above the triangle resistance and hold above the $230 level.
Failure to do so may extend the correction lower before resuming upward momentum.
Key Levels to Watch
Resistance: $230.64 (0.236 Fib) and $264.10 (Wave iii high).
Support Levels: $209.93 (0.382 Fib), $193.20 (0.5 Fib), and $176.47 (0.618 Fib).
Breakout Signal: A move above $230 could confirm Wave v’s start.
Downside Risk: A drop below $176.47 may invalidate the bullish triangle scenario.
RSI Insight: RSI recovery suggests the potential for a short-term upward move.
Disclaimer:
The information provided in this article is for informational purposes only. It is not intended to be, nor should it be construed as, financial advice. We do not make any warranties regarding the completeness, reliability, or accuracy of this information. All investments involve risk, and past performance does not guarantee future results. We recommend consulting a financial advisor before making any investment decisions.
Nikola Lazic is a cryptocurrency analyst and investor working in the industry since 2017. He holds a bachelor's degree in Sociology, which enables him to better understand the psychology behind the crowd´s positioning. Consequently his preferred analytical tool is Elliott Wave Theory in combination with price action analysis.
Combining his experience in trading and investing with knowledge in content writing he strives to bring the most accurate and actionable information.