The 4-h0ur chart shows SHIB has been declining within a well-defined descending wedge structure since the peak at $0.00003342 on Dec. 8, characterized by lower highs and lower lows.
The wedge structure suggests a corrective ABCDE wave sequence, with Wave Y potentially competing at the recent low around $0.000011
SHIBUSD WXY correction | Credit: Nikola Lazic/TradingView
The 0.786 Fibonacci retracement level at $0.00001504 has acted as strong support, with the price attempting to rebound from this zone.
The larger Elliott Wave count suggests that SHIB has been in a complex WXY correction since reaching its local high on Mar. 5 at $0.000045.
Wave W saw a substantial drop, followed by a corrective X wave that failed to breach the descending resistance.
The subsequent Y wave has been grinding lower, forming a series of corrective subwaves, culminating near critical support. The most recent price action hints at a potential end to this downward cycle.
The Relative Strength Index (RSI) on the 4-hour chart is deeply oversold, historically aligning with previous reversal points.
Furthermore, the interaction with the 0.786 Fibonacci level aligns with the conclusion of the corrective wave, increasing the likelihood of a potential bounce.
However, confirmation requires a sustained breakout above the descending wedge resistance, ideally with strong volume.
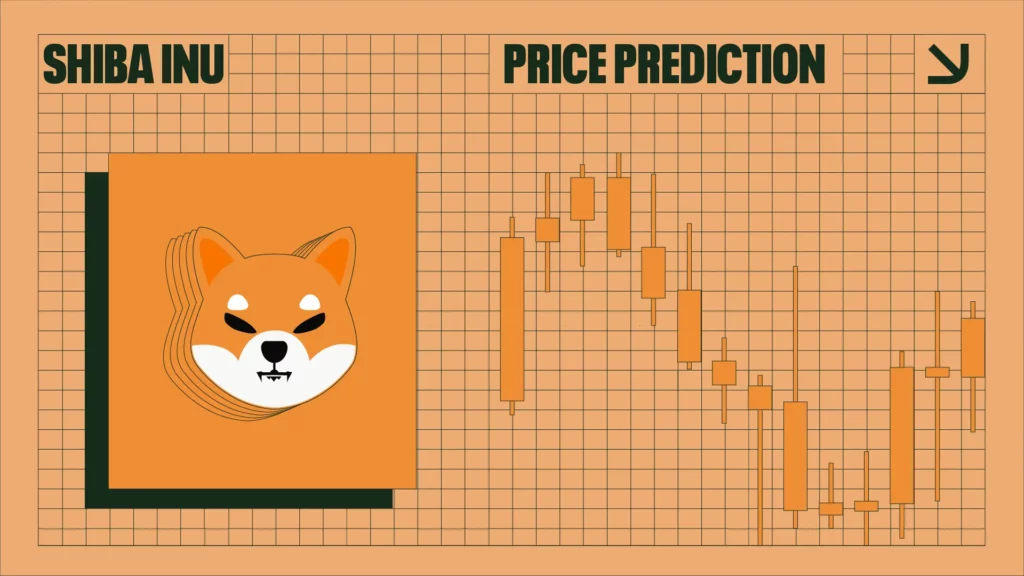
SHIB Price Prediction
The 1-hour chart provides a more detailed outlook on the potential breakout scenario. SHIB appears to have completed Wave E of the larger correction, forming a local double-bottom pattern near the $0.00001172 level.
This structure could propel the price toward key resistance levels if confirmed.
SHIBUSD potential breakout scenario | Credit: Nikola Lazic/TradingView
A breakout from the descending wedge could see SHIB testing the first major resistance at $0.00001504, which aligns with the 0.786 Fibonacci retracement.
Beyond that, the 0.618 level at $0.00002147 is a critical hurdle, marking the zone where previous lower highs have formed.
If bullish momentum sustains, the price could rally toward $0.00002599 (0.5 Fibonacci level), where significant selling pressure is expected.
A more extended move could see SHIB target $0.00003609 (0.236 Fibonacci) and complete a full corrective retracement.
However, failure to break above the descending wedge resistance would indicate continued downside risk.
A move below the $0.0000100 zone would invalidate the bullish reversal scenario, potentially leading to a retest of lower support levels.
Short-Term Target: Above $0.00003609 if bullish momentum sustains.
Invalidation Zone: Below $0.0000100, signaling further downside potential.
Disclaimer:
The information provided in this article is for informational purposes only. It is not intended to be, nor should it be construed as, financial advice. We do not make any warranties regarding the completeness, reliability, or accuracy of this information. All investments involve risk, and past performance does not guarantee future results. We recommend consulting a financial advisor before making any investment decisions.
Nikola Lazic is a cryptocurrency analyst and investor working in the industry since 2017. He holds a bachelor's degree in Sociology, which enables him to better understand the psychology behind the crowd´s positioning. Consequently his preferred analytical tool is Elliott Wave Theory in combination with price action analysis.
Combining his experience in trading and investing with knowledge in content writing he strives to bring the most accurate and actionable information.