NEAR Protocol is showing renewed bullish momentum after breaking a key descending trendline. Buyers are targeting $3.10 resistance. | Credit: CCN.com
Share
Key Takeaways
NEAR is up roughly 2% in 24 hours, approaching its year-to-date high near $1.80, driven by Nvidia’s plans to launch NemoClaw, alongside broader macro relief following Trump’s remarks on the Iran conflict.
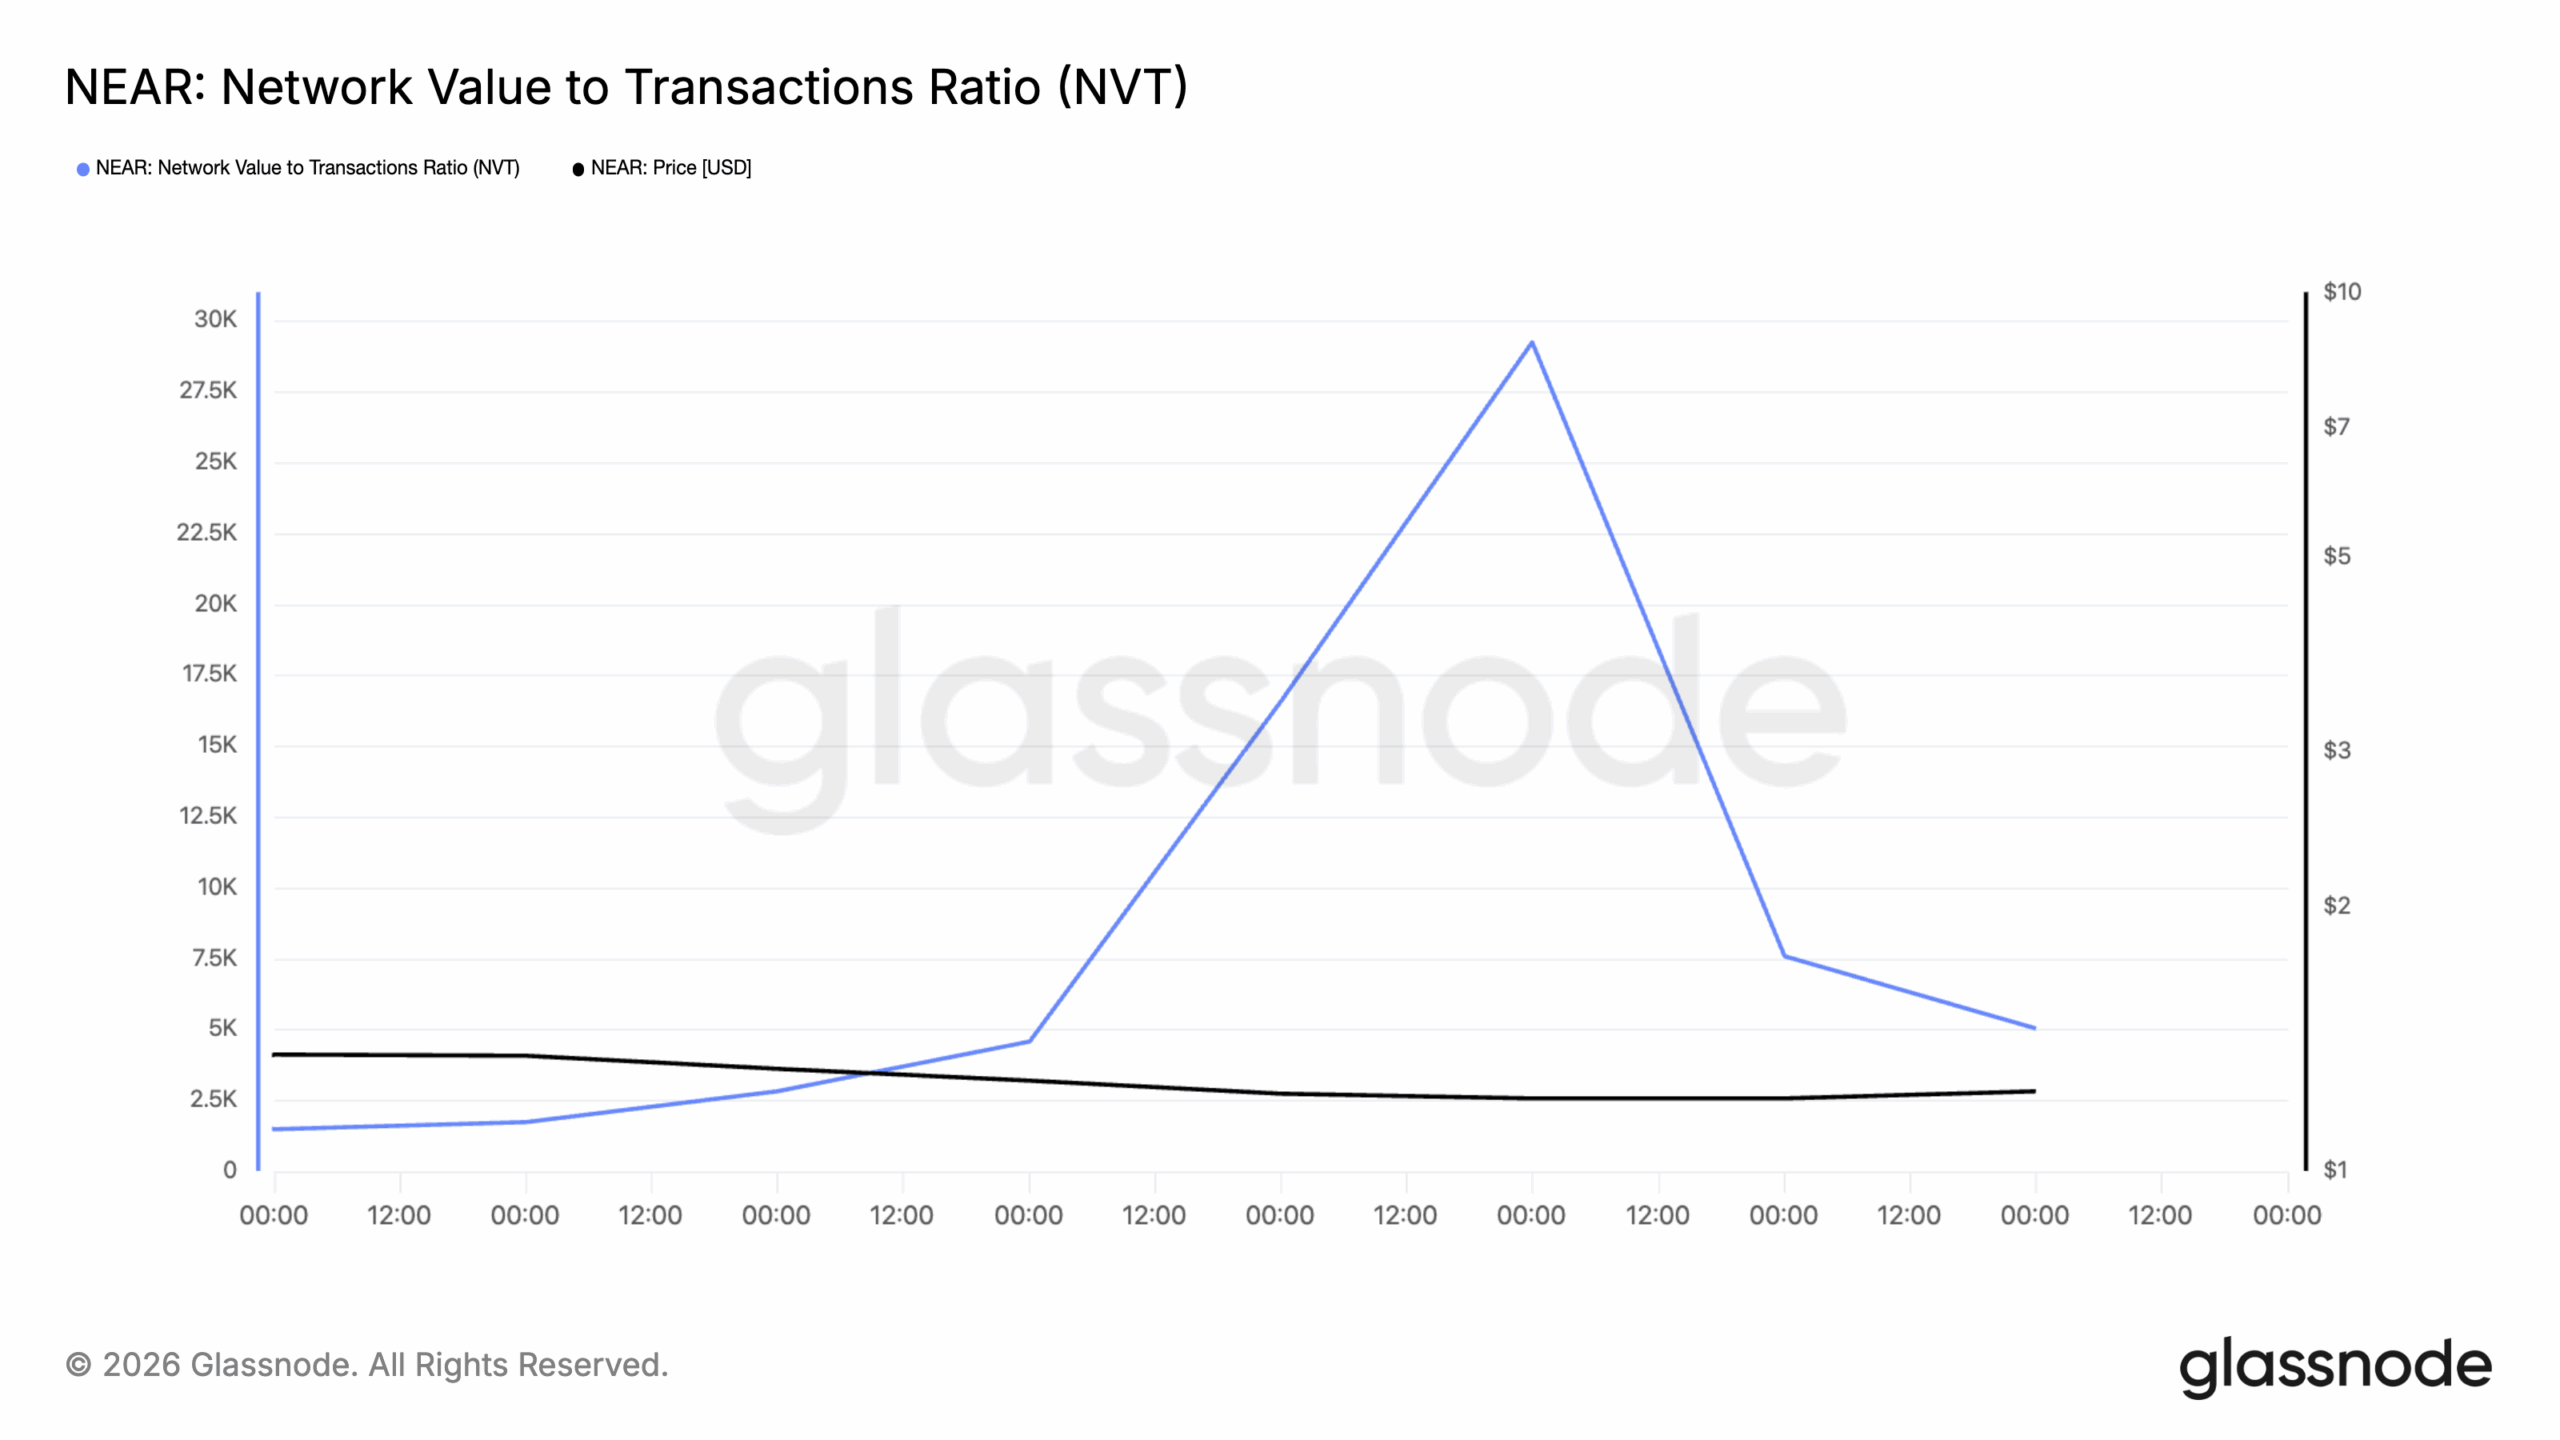
NEAR’s NVT Ratio has declined sharply over the past three days, signalling that on-chain transaction volume is outpacing the token’s market capitalization.
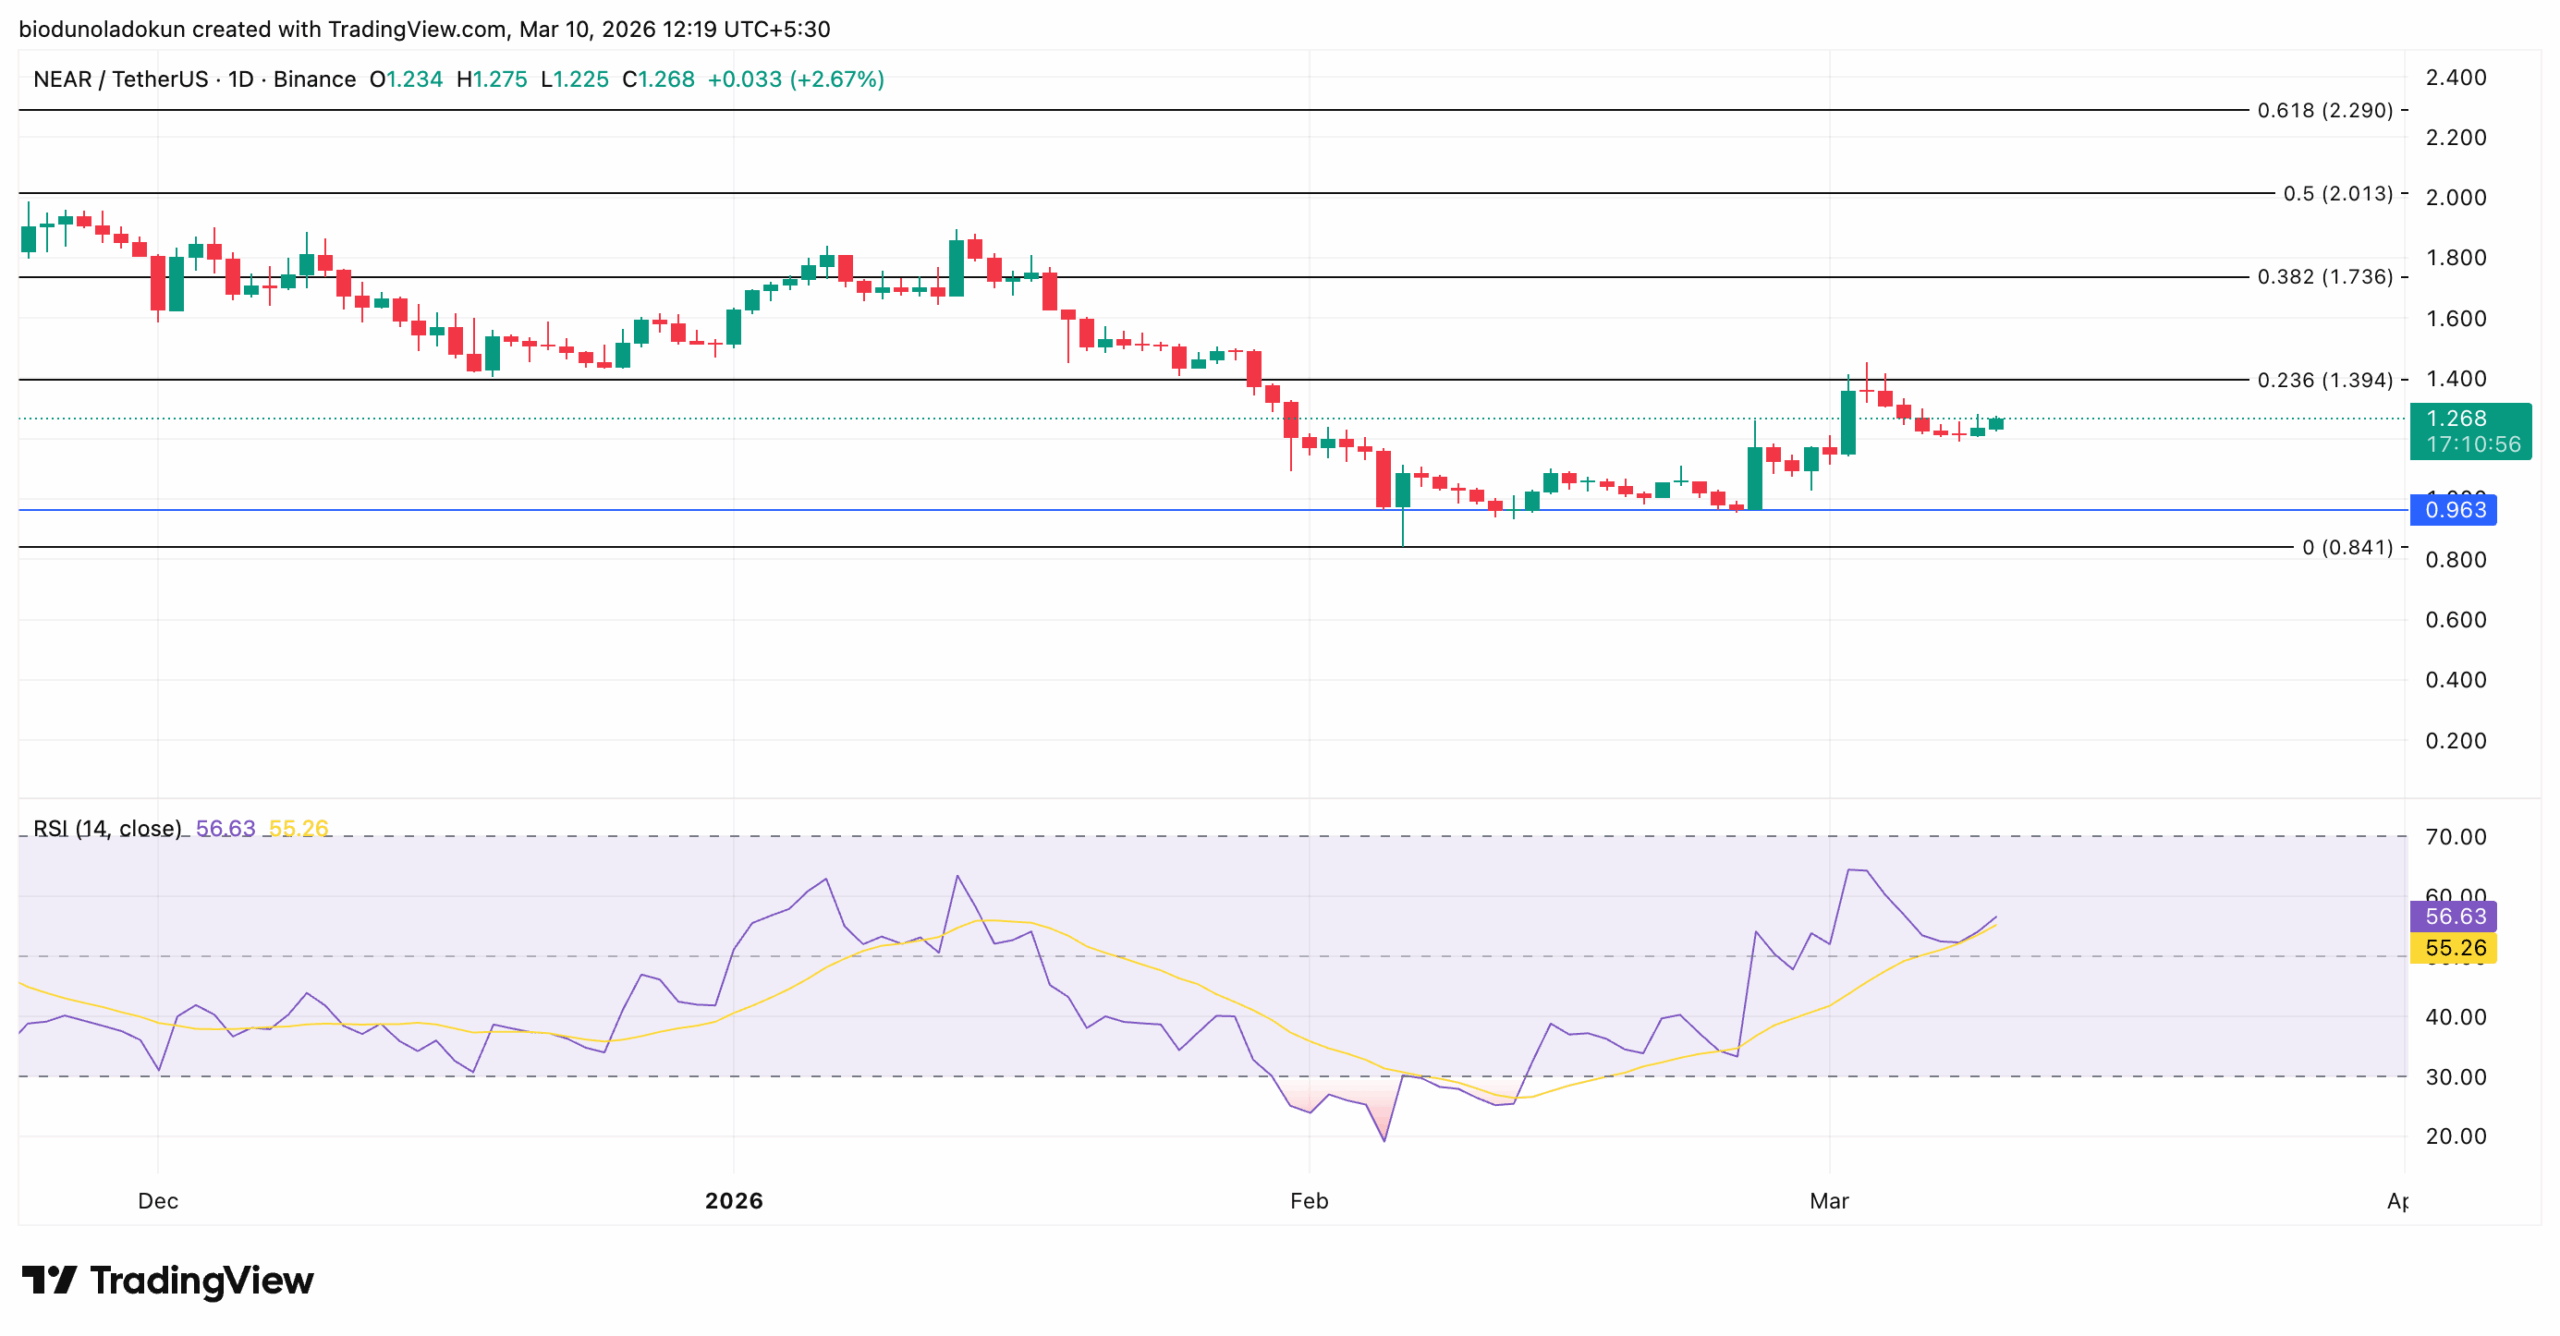
Technically, NEAR trades below the $1.39 resistance level with an RSI of 56.12 trending upward; a close above that barrier would lead to further rallies.
NEAR Protocol’s native coin has climbed roughly 2% in the past 24 hours, pushing toward its year-to-date high in the $1.80 zone.
The move comes on the back of broader macro relief and, more directly, fresh reports that chipmaker Nvidia is planning to launch an open-source platform for artificial intelligence (AI) agents. The news has driven gains across the AI token ecosystem over the past day.
With on-chain and technical indicators confirming rising demand, NEAR appears poised to extend its gains in the near term.
Nvidia’s NemoClaw Plans Trigger AI Token Demand Surge
Following the March 9 publication of a Wired report that Nvidia plans to launch an open-source platform for autonomous AI agents, artificial intelligence-linked tokens have noted a significant uptick in demand.
According to the report, the product, internally referred to as NemoClaw, is designed to enable companies to deploy AI agents to perform complex knowledge-based tasks on behalf of their employees.
The announcement comes amid broader enthusiasm for autonomous AI agents. This trend has grown following the viral success of open-source agent tools like OpenClaw.
NEAR is among the tokens that have benefited directly from this development, seeing significant capital rotation over the past day.
This is also due in part to the broader improvement in market risk appetite. Sentiment improved after remarks from President Donald Trump suggested the U.S.-led military campaign in Iran may be approaching its conclusion.
In a phone interview with CBS News on Monday, Trump said the war with Iran could almost be over.
“I think the war is very complete, pretty much,” the president noted.
The comments have eased some of the pressure that has weighed on risk assets in the past week, with crypto markets staging a partial recovery on Tuesday.
On-Chain Data Backs the Bull Case for NEAR
On-chain, NEAR receives some bullish backing. Per Glassnode, the coin’s Network Value to Transactions (NVT) Ratio has declined steadily in the past three days.
This signals that transaction volume on the NEAR Protocol exceeds the token’s current market valuation.
An asset’s NVT ratio determines whether it is overvalued or undervalued by comparing its market capitalization to transaction volume.
When the ratio spikes, it indicates that the asset’s market capitalization is growing faster than the volume of value transacted on its network, suggesting overvaluation. This trend normally precedes downward price corrections.
On the other hand, when it falls like this, it means the asset is undervalued, as network transaction volume outpaces market capitalization.
Traders usually view periods of undervaluation like this as opportunities to accumulate. This gives NEAR room to extend its rally, as long as demand is sustained.
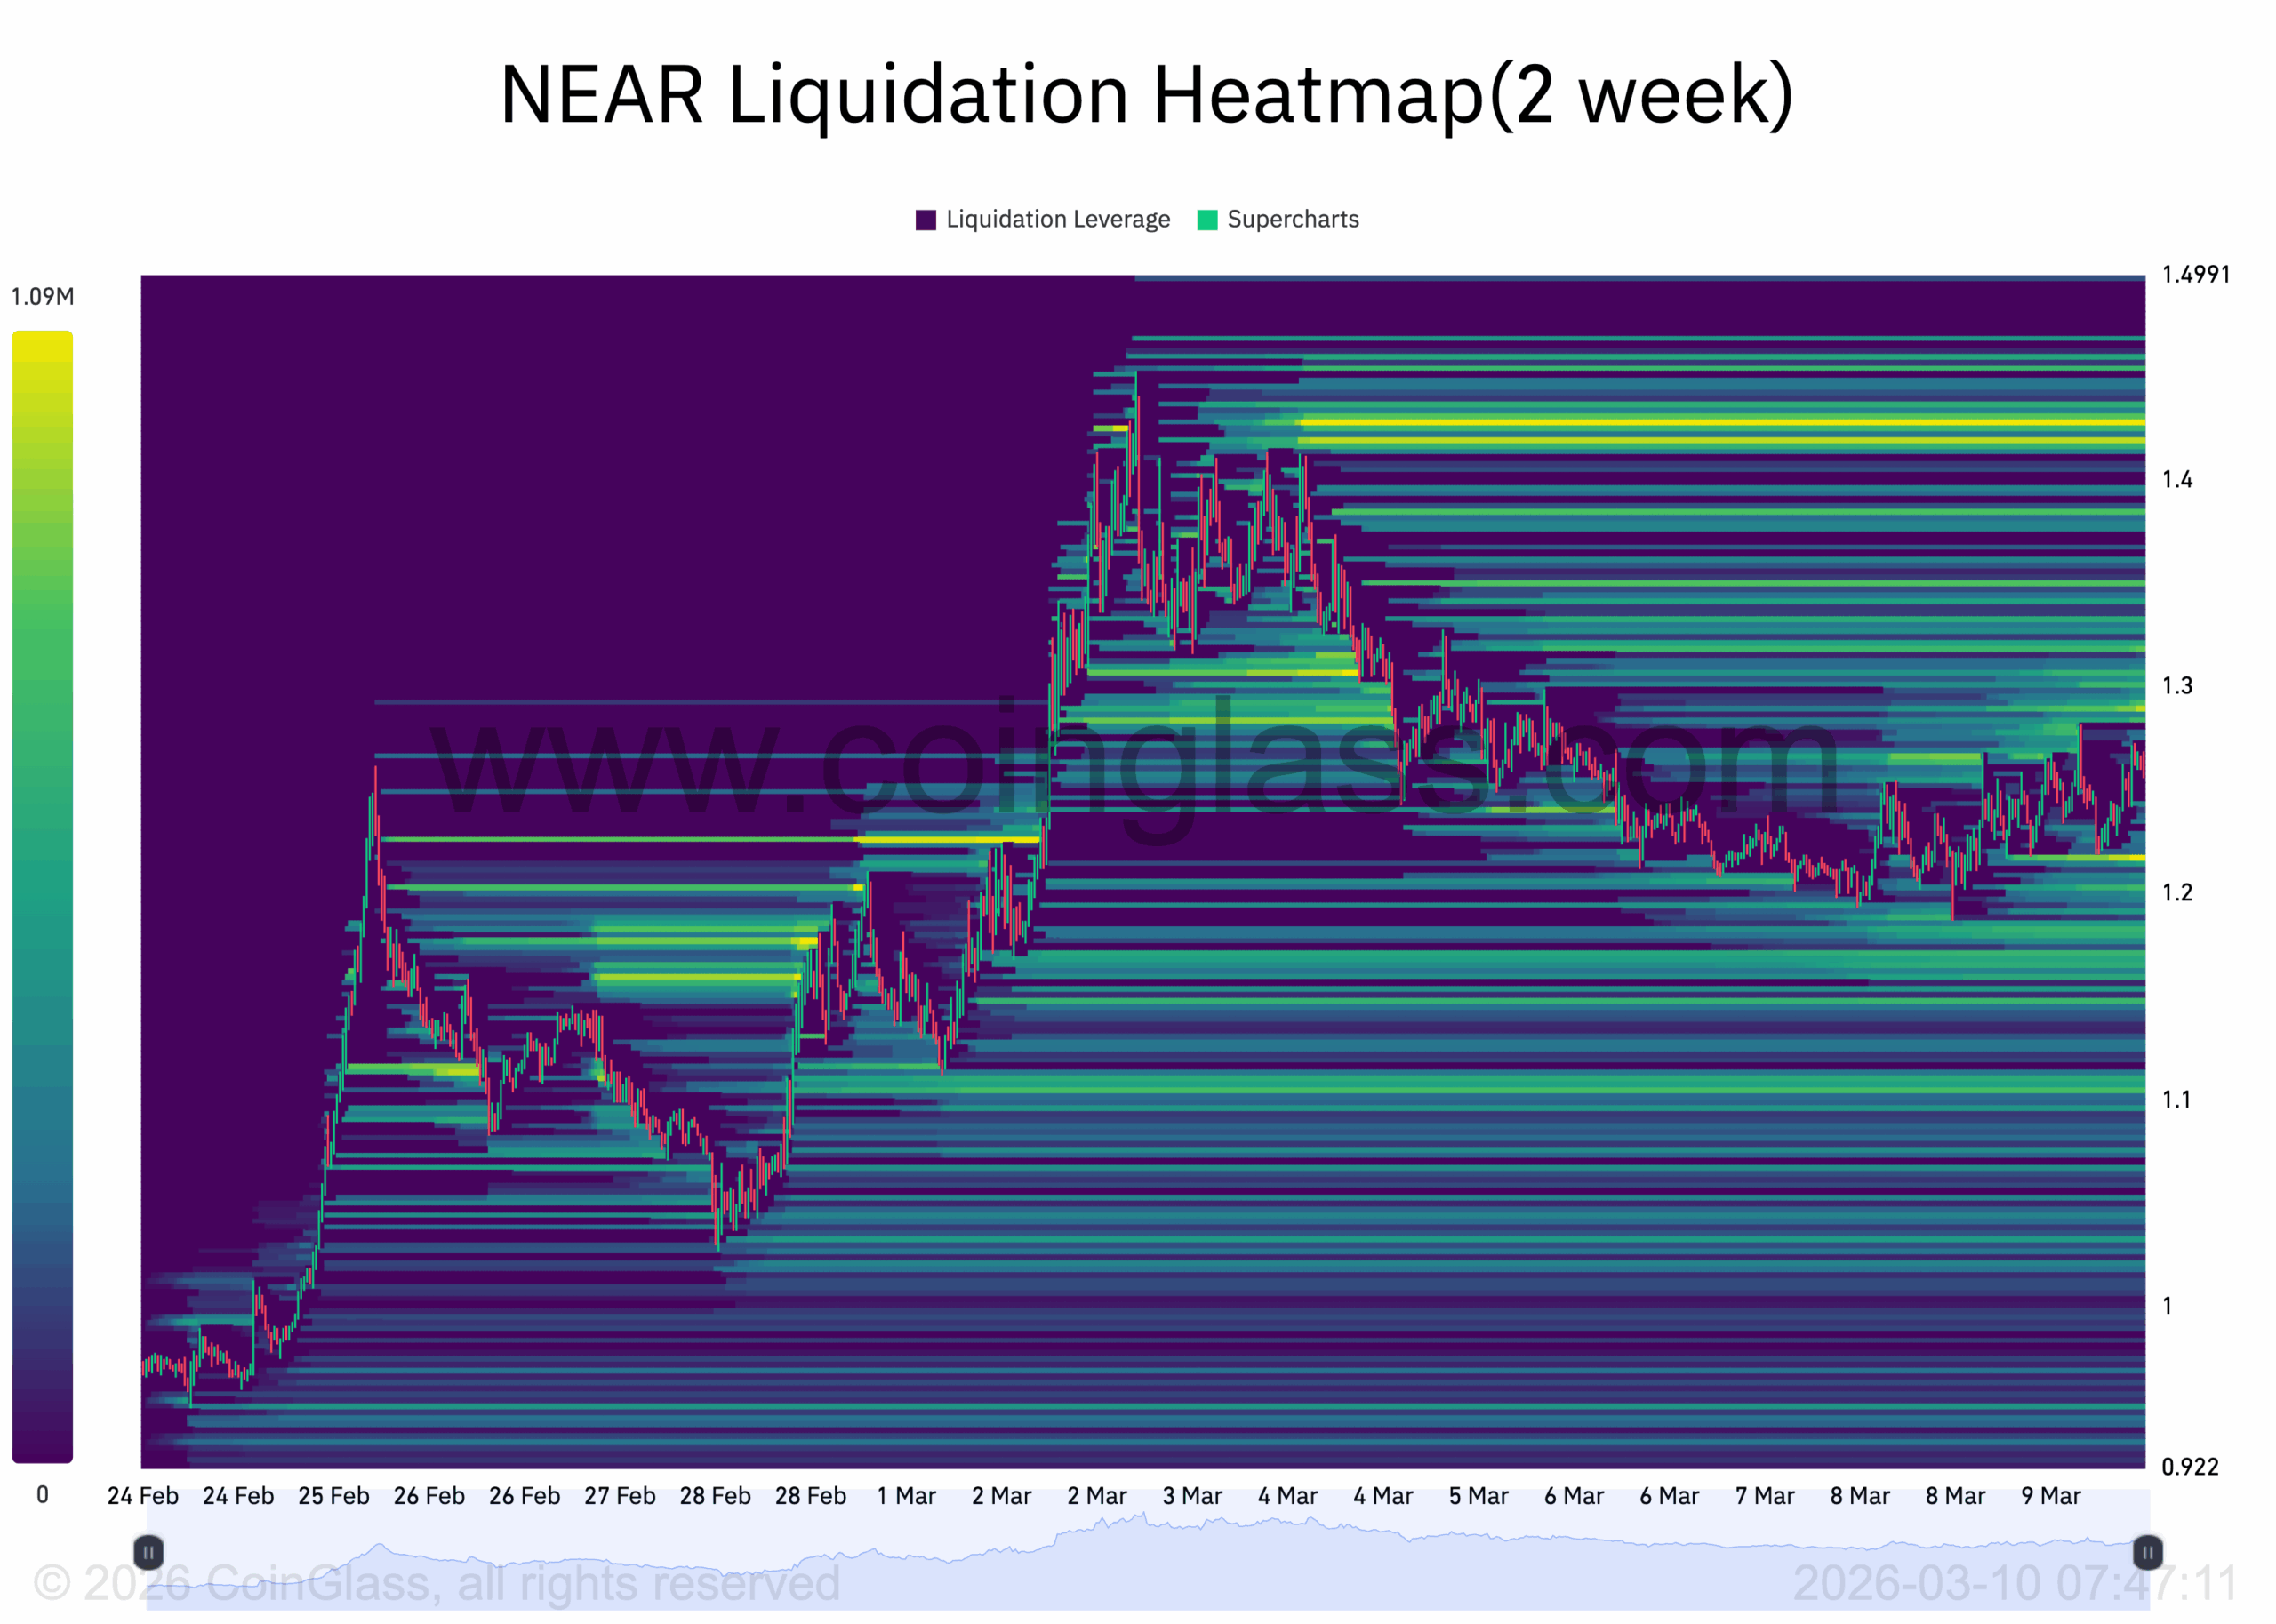
Furthermore, readings from the coin’s Liquidation Heatmap support this bullish outlook. According to Coinglass, NEAR’s liquidation heatmap shows a notable concentration of liquidity around the $1.43 price zone.
Liquidation heatmaps are visual tools traders use to identify price levels where dense clusters of leveraged positions are likely to be liquidated.
These maps highlight areas of high liquidity, often color-coded to indicate intensity, with brighter zones indicating greater liquidation potential.
Usually, these price zones act as magnets for price action, as the market tends to move toward these areas to trigger liquidations and open fresh positions.
Therefore, should NEAR’s ongoing rally push it into that zone, forced short liquidations would likely push prices higher.
One Level Stands Between Here and $1.80
At press time, NEAR trades below the key resistance formed at $1.39. Its climbing Relative Strength Index (RSI) confirms the surge in spot demand and hints at a break above this barrier.
At 56.12, the momentum indicator suggests growing bullish momentum without yet entering overbought conditions, leaving room for further upside.
If buy-side pressure intensifies, NEAR could reclaim the $1.39 resistance. A daily close above it would open the path to the 0.382 retracement level, near the year-to-date high at $1.80.
On the downside, a failure to hold above $1.39 could see NEAR retrace toward the $0.96 psychological support level, which served as a key floor during the February sell-off.
A breach of that level would bring the Fibonacci base at $0.84 back into play.
[You-may-like]
Disclaimer:
The information provided in this article is for informational purposes only. It is not intended to be, nor should it be construed as, financial advice. We do not make any warranties regarding the completeness, reliability, or accuracy of this information. All investments involve risk, and past performance does not guarantee future results. We recommend consulting a financial advisor before making any investment decisions.
Abiodun Oladokun is a Research Analyst at CCN, where he covers cryptocurrency markets with a focus on on-chain analysis, technical assessments, and emerging trends across decentralized finance (DeFi), real-world assets (RWA), artificial intelligence (AI), decentralized physical infrastructure networks (DePIN), Layer 2s, and meme coins.
Prior to CCN, he served as a Senior On-Chain Analyst at BeInCrypto, producing market reports spanning diverse crypto sectors.
Before that, he conducted technical analysis and market assessments of various altcoins at AMBCrypto, where he also contributed long-form quarterly research papers on DeFi, NFTs, DAOs, and scaling architectures, leveraging on-chain platforms including Messari, Santiment, DefiLlama, and Dune Analytics.
He began his crypto career as a research analyst at SixthSense DAO, developing blockchain forensic tools to trace the history of stolen assets.
Abiodun is a lawyer called to the Nigerian Bar and the founder of Ilé Ijó, a Lagos-based electronic dance music collective.