MINA price started a new uptrend since August but struggled to surpass $1 mark. Will it do so on the next attempt?
Share
Key Takeaways
Breakout Potential: Price broke the downtrend, signaling renewed bullish strength.
Key Levels: Strong support at $0.67 and resistance at $1.00.
Upside Target: A Wave (v) move could push towards $1.15 and $2.41.
MINA’s price has shown a strong recovery since stabilizing at $0.38 in August. It completed a 5-wave rally before entering a healthy correction phase.
After peaking at $1.00 on December 6 and retracing to $0.70, the price is consolidating near $0.78.
Key Fibonacci levels and support zones suggest a potential upward continuation, with resistance and momentum indicators pointing to a cautious yet optimistic outlook for buyers.
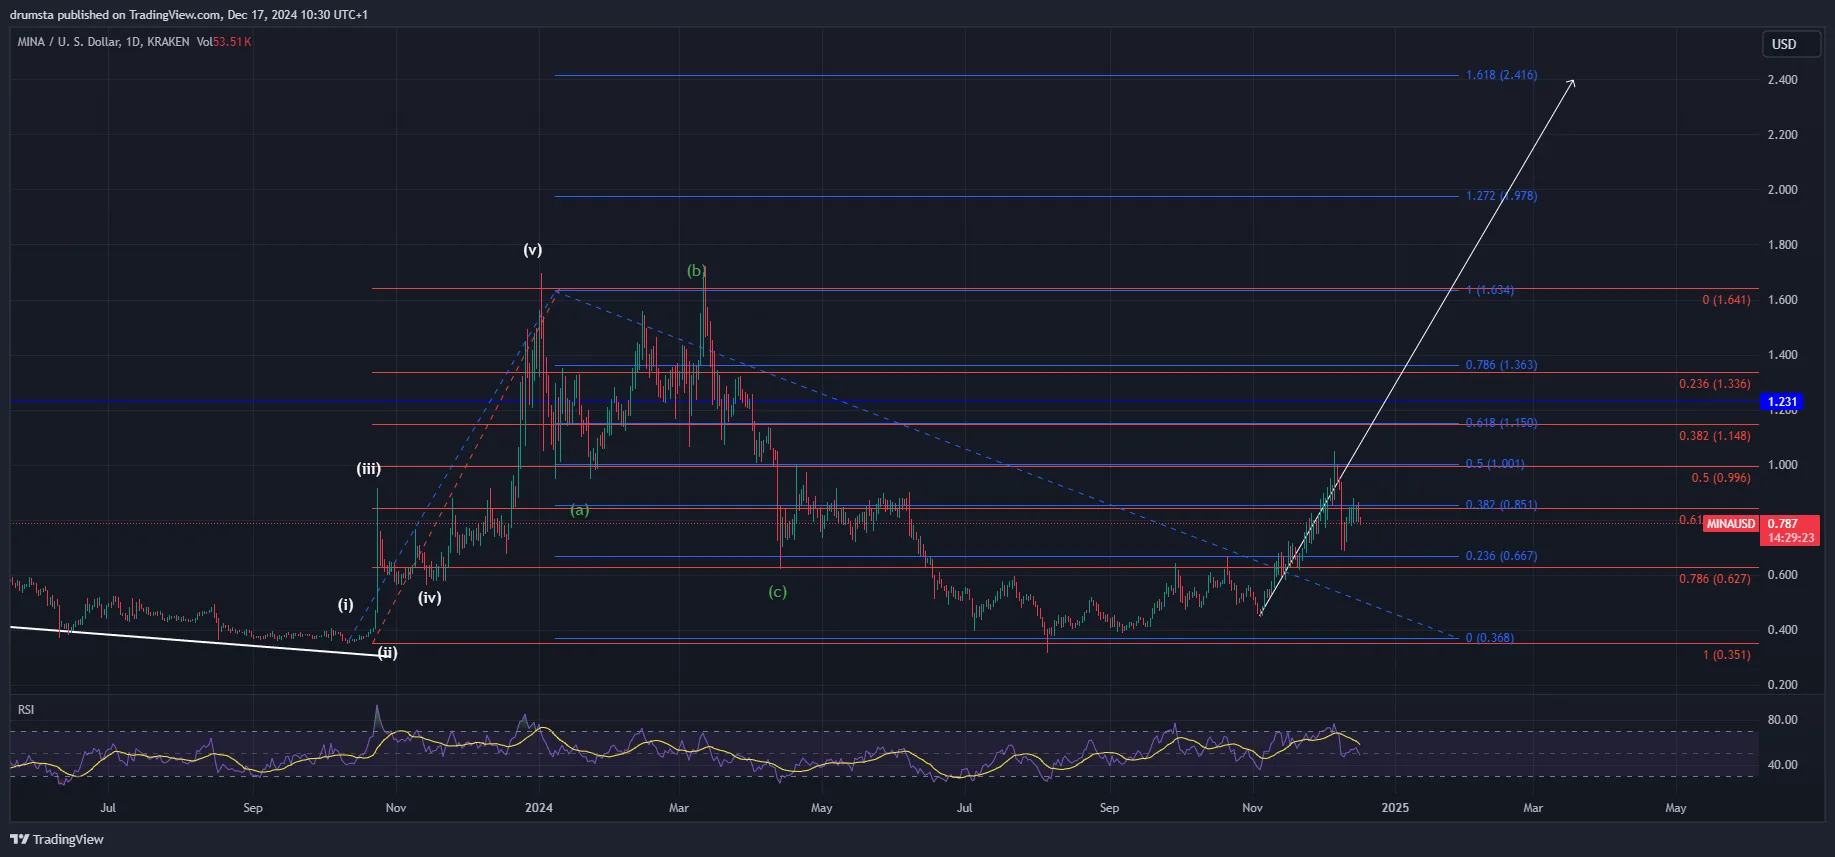
The MINA daily chart shows that the price has increased since stabilizing around $0.38 in August.
After a completed 5-wave rally (i-v), MINA entered a correction that lasted throughout 2024.
The price recently broke out of a long-term downtrend, indicating a potential upward trend continuation with targets aligned to Fibonacci extensions.
MINAUSD Uptrend developing | Credit: Nikola Lazic/TradingView
On Dec. 6, it reached a high of $1 and then declined to a low of $0.70 but started increasing again.
A successful breakout above these levels can push the price towards the 1.618 extension ($2.41).
The daily chart Relative Strength Index (RSI) shows moderate momentum but risks overbought conditions, suggesting cautious optimism for buyers.
MINA’s price currently consolidates near $0.78 after breaking the $0.67 resistance (0.236 Fib level).
If it holds above this region, the price could gain strength to test higher resistances.
Volume remains moderate, hinting at investor interest but requiring stronger confirmation for a larger rally.
Key Observations
Breakout Potential: Price recently broke out of a downtrend, signaling bullish momentum.
Fibonacci Extensions: Bullish targets are $1.63 (1.0) and $2.41 (1.618).
Elliott Waves: A completed ABC correction indicates the beginning of a new upward wave.
RSI Insight: RSI momentum shows potential but risks overbought conditions with further gains.
MINA Price Prediction
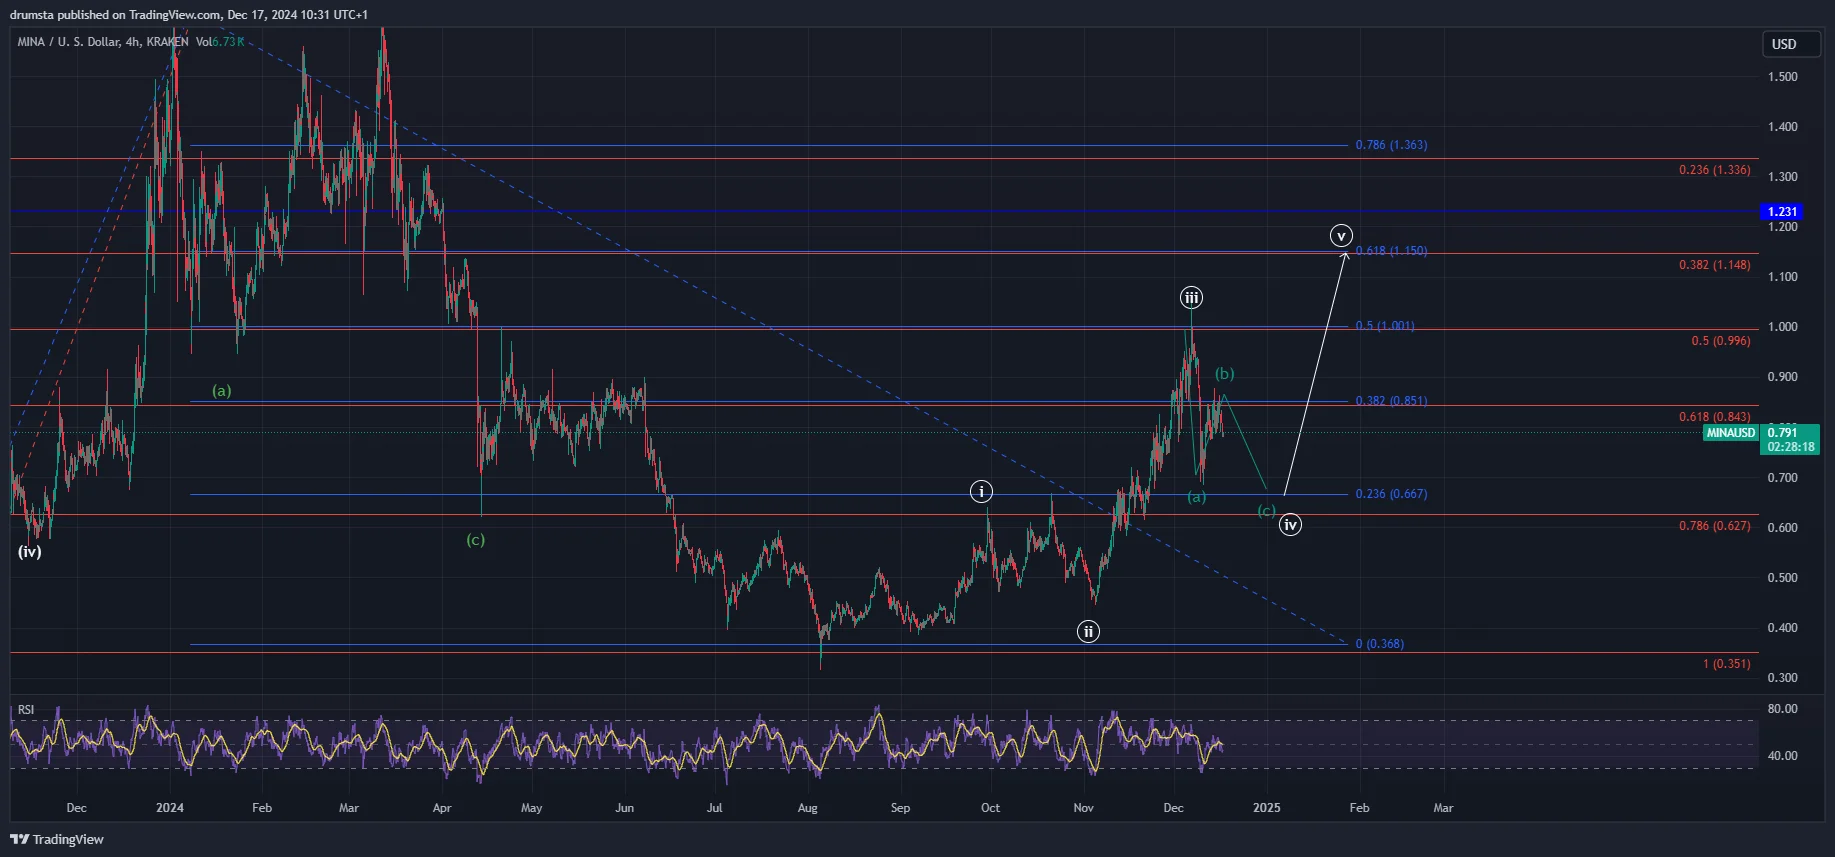
The hourly chart of MINA highlights an ongoing correction in a potential 5-wave structure. After Wave (iii) peaked near $1.00, MINA retraces, potentially forming a Wave (iv) correction.
Fibonacci retracements indicate key areas where a bounce could occur to push towards the next upward target.
MINAUSD ABC correction could be developing | Credit: Nikola Lazic/TradingView
Wave (iv) retracement targets are near $0.67 (0.236 Fib) and $0.62 (0.786 Fib), acting as strong support zones.
A confirmed bounce from these levels could lead to a Wave (v) move toward $1.15 (0.618 Fib extension) and beyond. The RSI shows consolidation, signaling a potential reversal after the correction is completed.
Volume remains relatively low during the retracement, suggesting the correction is healthy.
For bullish continuation, MINA needs to reclaim key resistance levels at $0.84 (0.618 Fib retracement) and $1.00 (0.5 Fib). A break above these would validate the bullish scenario targeting higher levels.
Key Levels to Watch
Support Levels: $0.67 (0.236 Fib) and $0.62 (0.786 correction).
Resistance Levels: $0.84 (0.618 Fib) and $1.00 (0.5 Fib).
Bullish Target: $1.15 (0.618 Fib extension) if Wave (v) begins.
Downside Risk: A $0.62 failing could lead to a further decline toward $0.51.
Disclaimer:
The information provided in this article is for informational purposes only. It is not intended to be, nor should it be construed as, financial advice. We do not make any warranties regarding the completeness, reliability, or accuracy of this information. All investments involve risk, and past performance does not guarantee future results. We recommend consulting a financial advisor before making any investment decisions.
Nikola Lazic is a cryptocurrency analyst and investor working in the industry since 2017. He holds a bachelor's degree in Sociology, which enables him to better understand the psychology behind the crowd´s positioning. Consequently his preferred analytical tool is Elliott Wave Theory in combination with price action analysis.
Combining his experience in trading and investing with knowledge in content writing he strives to bring the most accurate and actionable information.