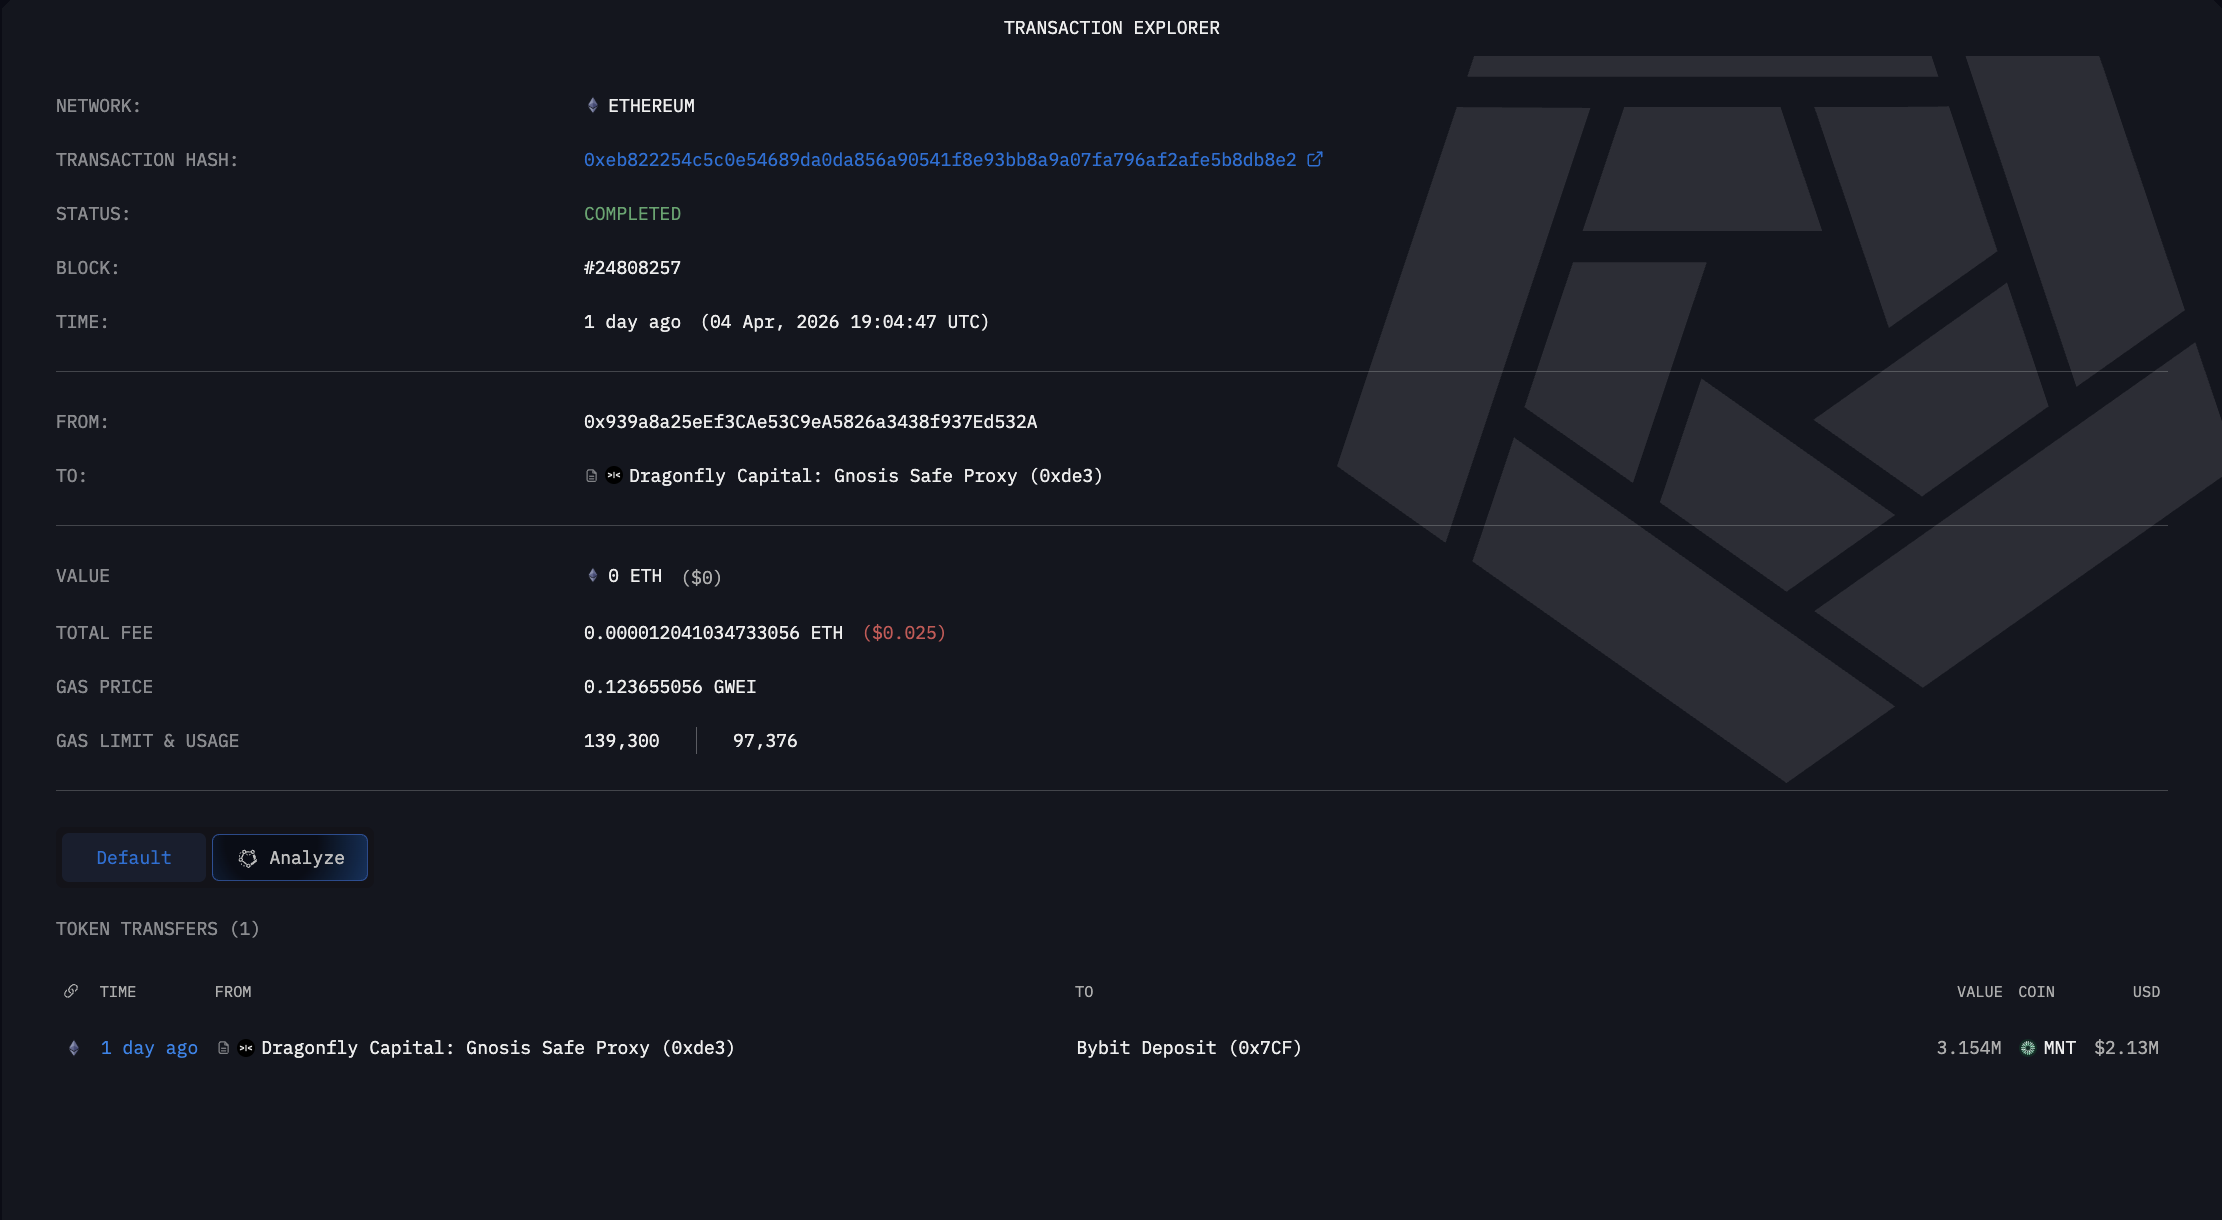
Dragonfly moved $2.12 million in MNT tokens to Bybit, draining its MNT holdings to zero and triggering a broad selloff that pushed MNT to a 24-day low of $0.65.
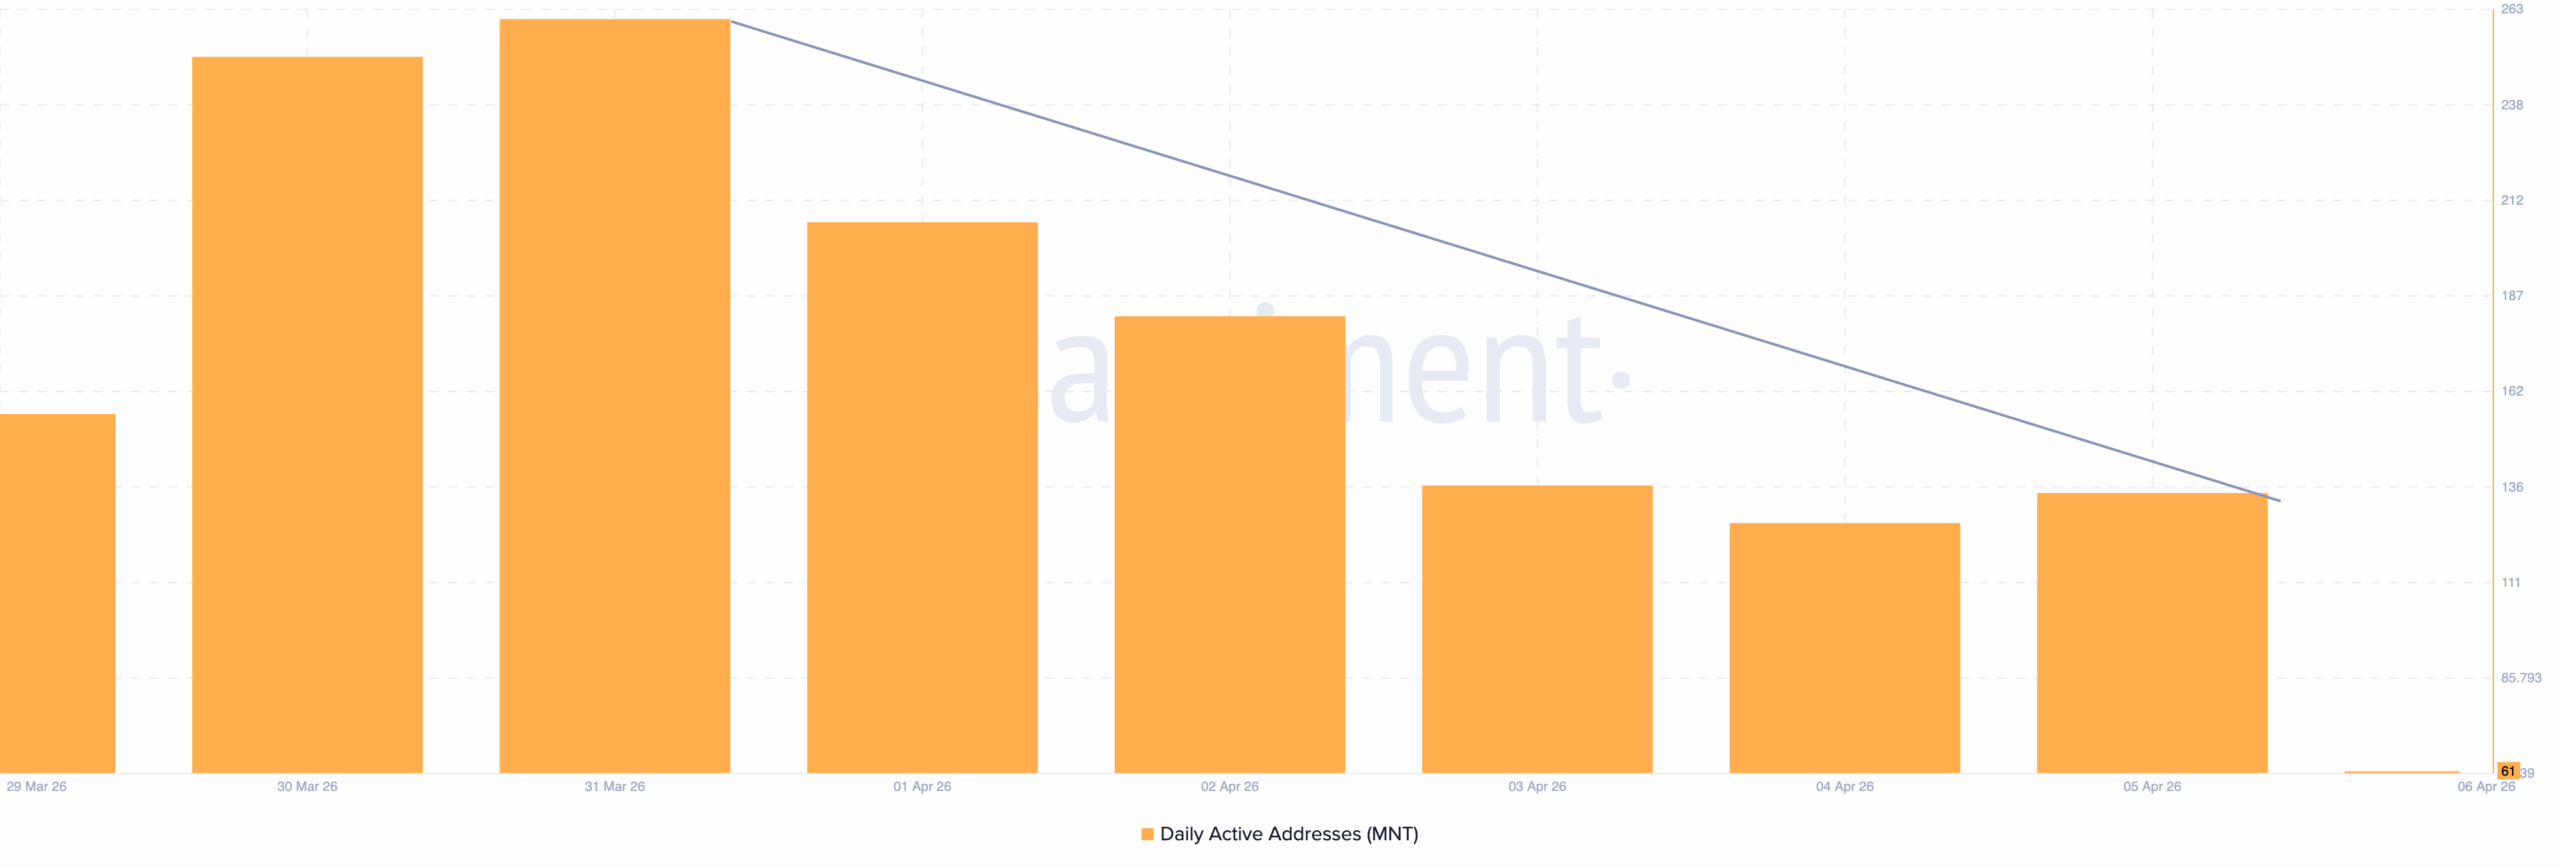
On-chain data shows Mantle’s daily active addresses collapsed 76% in under a week, from 253 on March 31 to just 61 on April 6, signaling sharply weakening organic demand despite the token’s 2% price rebound.
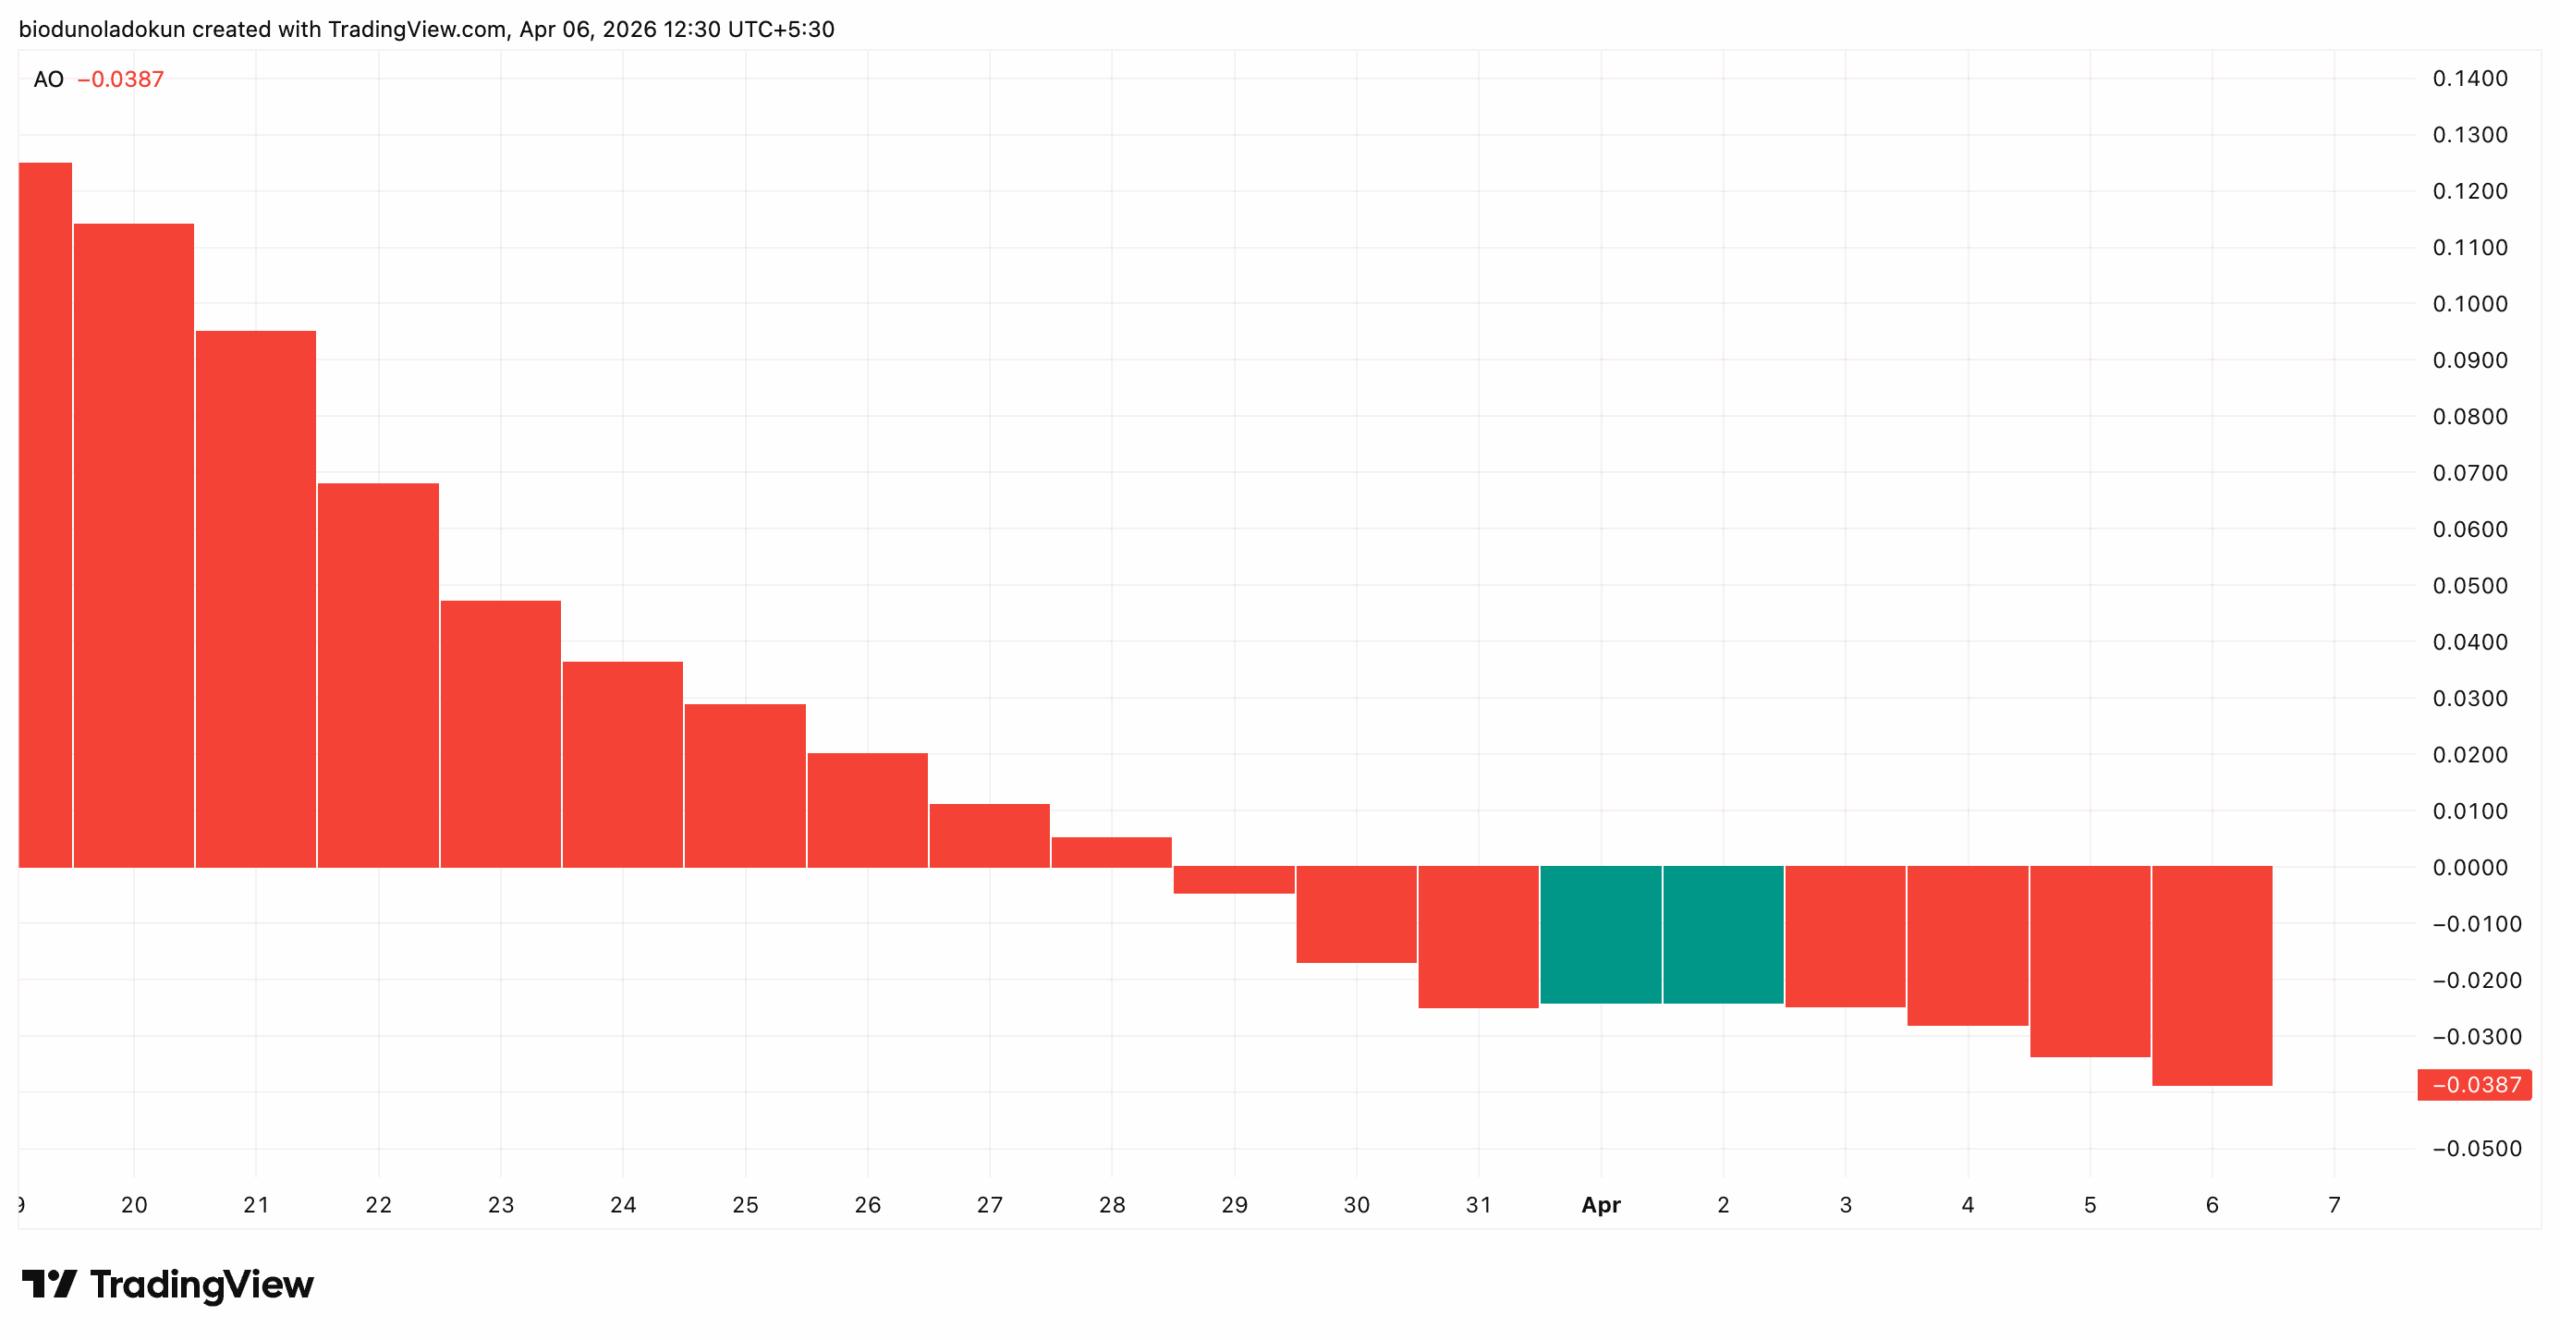
MNT’s Awesome Oscillator has printed red bars since April 3, weighted sentiment has turned negative, and the Smart Money Index is down, all of which hint at further price declines.
Dragonfly’s sudden transfer of $2.12 million in Mantle (MNT) tokens to the cryptocurrency exchange Bybit on April 4 triggered a market-wide sell-off, briefly pushing the token to its lowest price in 24 days by April 5.
While the altcoin has rebounded over the past day, mirroring the market-wide rally, on-chain and technical data reveal underlying weakness.
Dragonfly Empties MNT Wallet
According to data from the blockchain intelligence platform Arkham, the $2.12 million MNT transfer marked Dragonfly’s first outflow from its known crypto wallets in two months and drained its MNT holdings to zero.
According to Santiment, daily active addresses on the Mantle Network peaked at 253 on March 31 before entering a sustained decline, dropping to just 61 as of April 6.
That represents a 76% drop in active network participation in under a week, signaling a sharp decline in organic demand and user engagement on the Mantle network.
This kind of divergence — where price attempts to recover while network activity continues to contract — is interpreted as a bearish signal. It suggests the MNT’s current bounce is driven by short-term speculative interest rather than genuine buying.
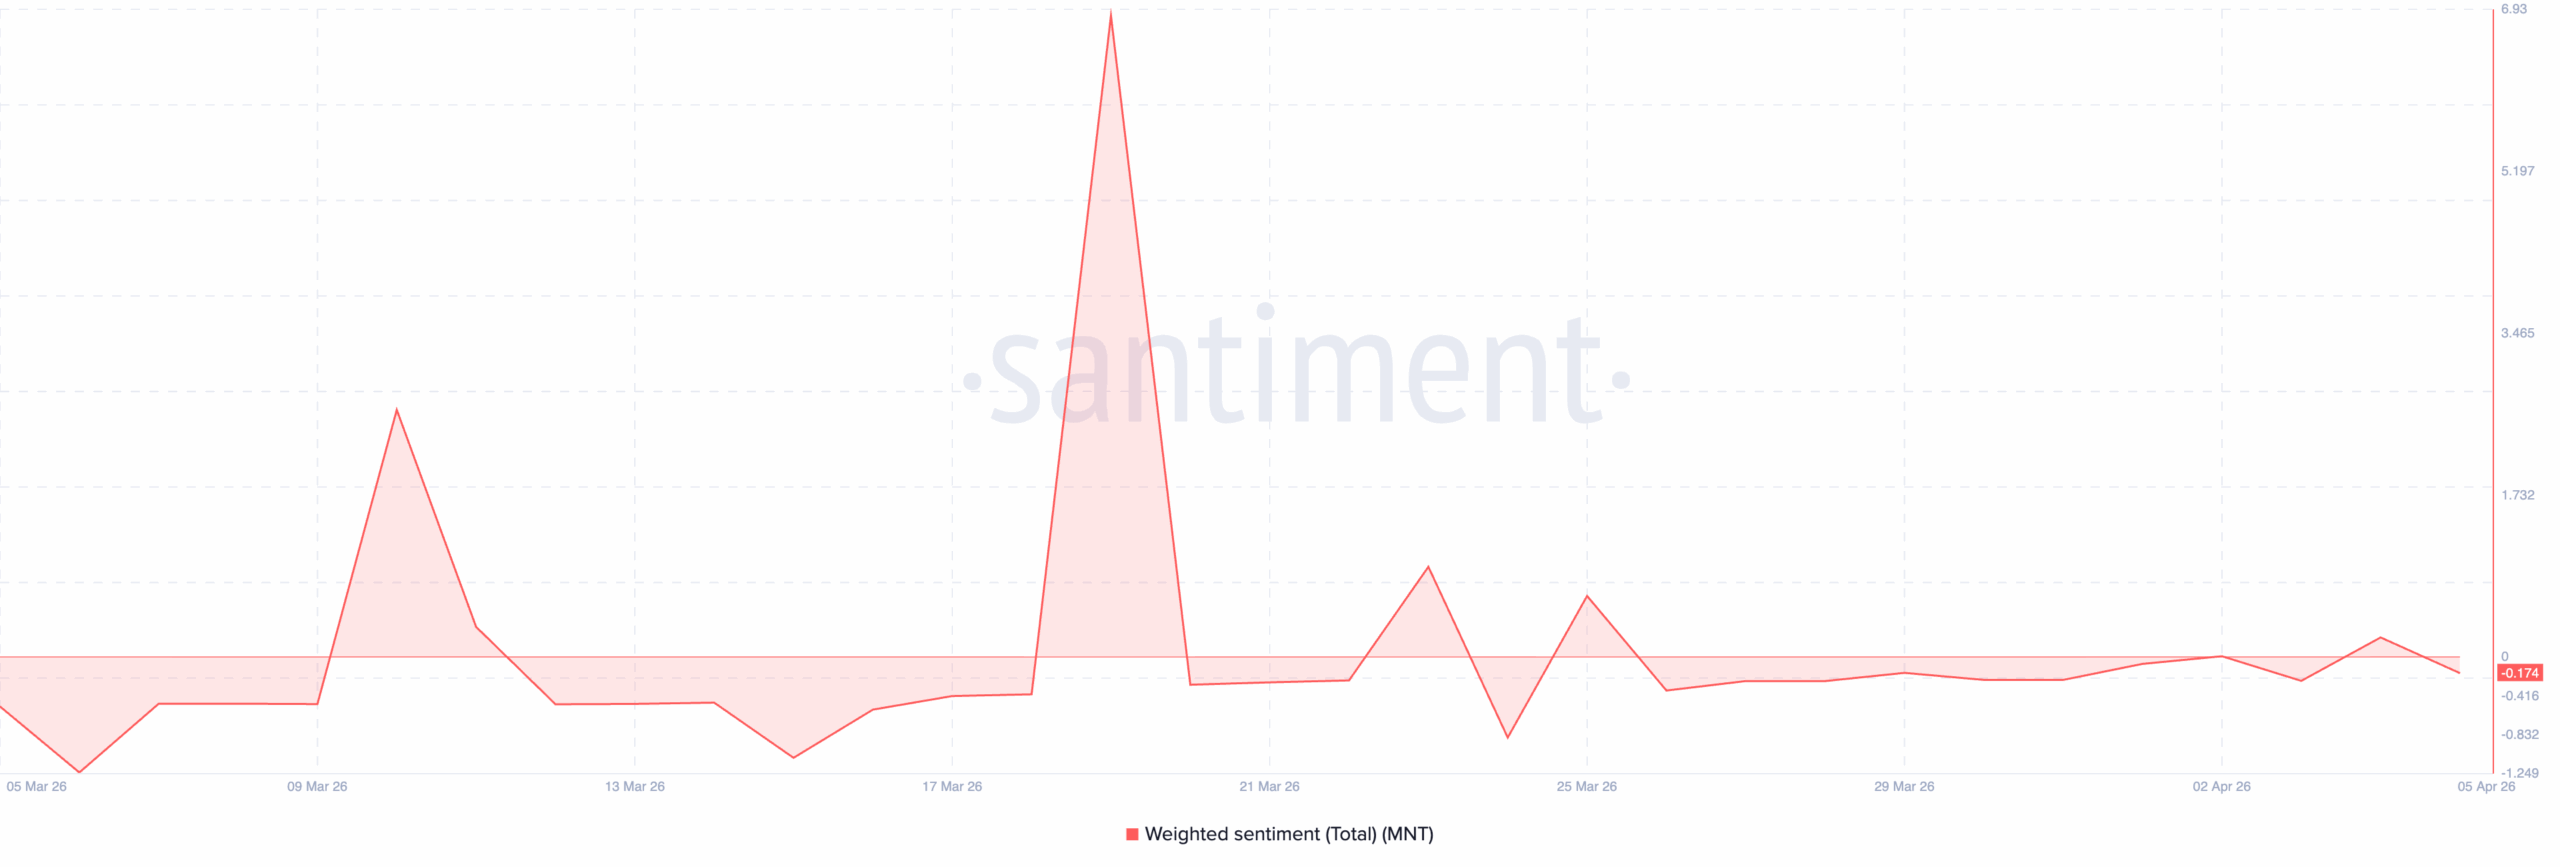
Moreover, the general market’s sentiment toward MNT has flipped bearish, as reflected by its negative weighted sentiment metric.
This on-chain metric measures the overall sentiment of social media mentions about an asset, accounting for both the volume and polarity of comments.
A negative weighted sentiment indicates that most social media mentions are negative, suggesting a bearish sentiment towards the asset.
According to Santiment, MNT’s weighted sentiment metric spent much of March trending below the zero line, with only brief, short-lived spikes into positive territory.
After attempting to recover and hold above zero in the final days of March and the first days of April, sentiment has since slipped back below the zero line, printing at -0.174 as of April 5.
This indicates that Dragonfly’s exchange transfer is stoking fresh fears of a sell-off. It may pull prices lower in the near term as bearish sentiment regains the upper hand.
Fading Bullish Momentum Hints at New Lows
Readings from the MNT daily chart paint a similar cautious picture. For example, since April 3, MNT’s Awesome Oscillator has been negative, printing red bars, suggesting fading bullish momentum.
The Awesome Oscillator compares an asset’s current market momentum with its longer-term momentum, helping identify potential trend shifts.
When it shows green histogram bars and positive values, it indicates that the current momentum is strong and bullish sentiment is increasing. This suggests that the asset’s price could continue to rise.
On the other hand, as with MNT, when the oscillator falls into negative territory and prints red bars consistently, it means that selling pressure is building and bullish conviction is fading.
This puts MNT at risk of shedding recent gains.
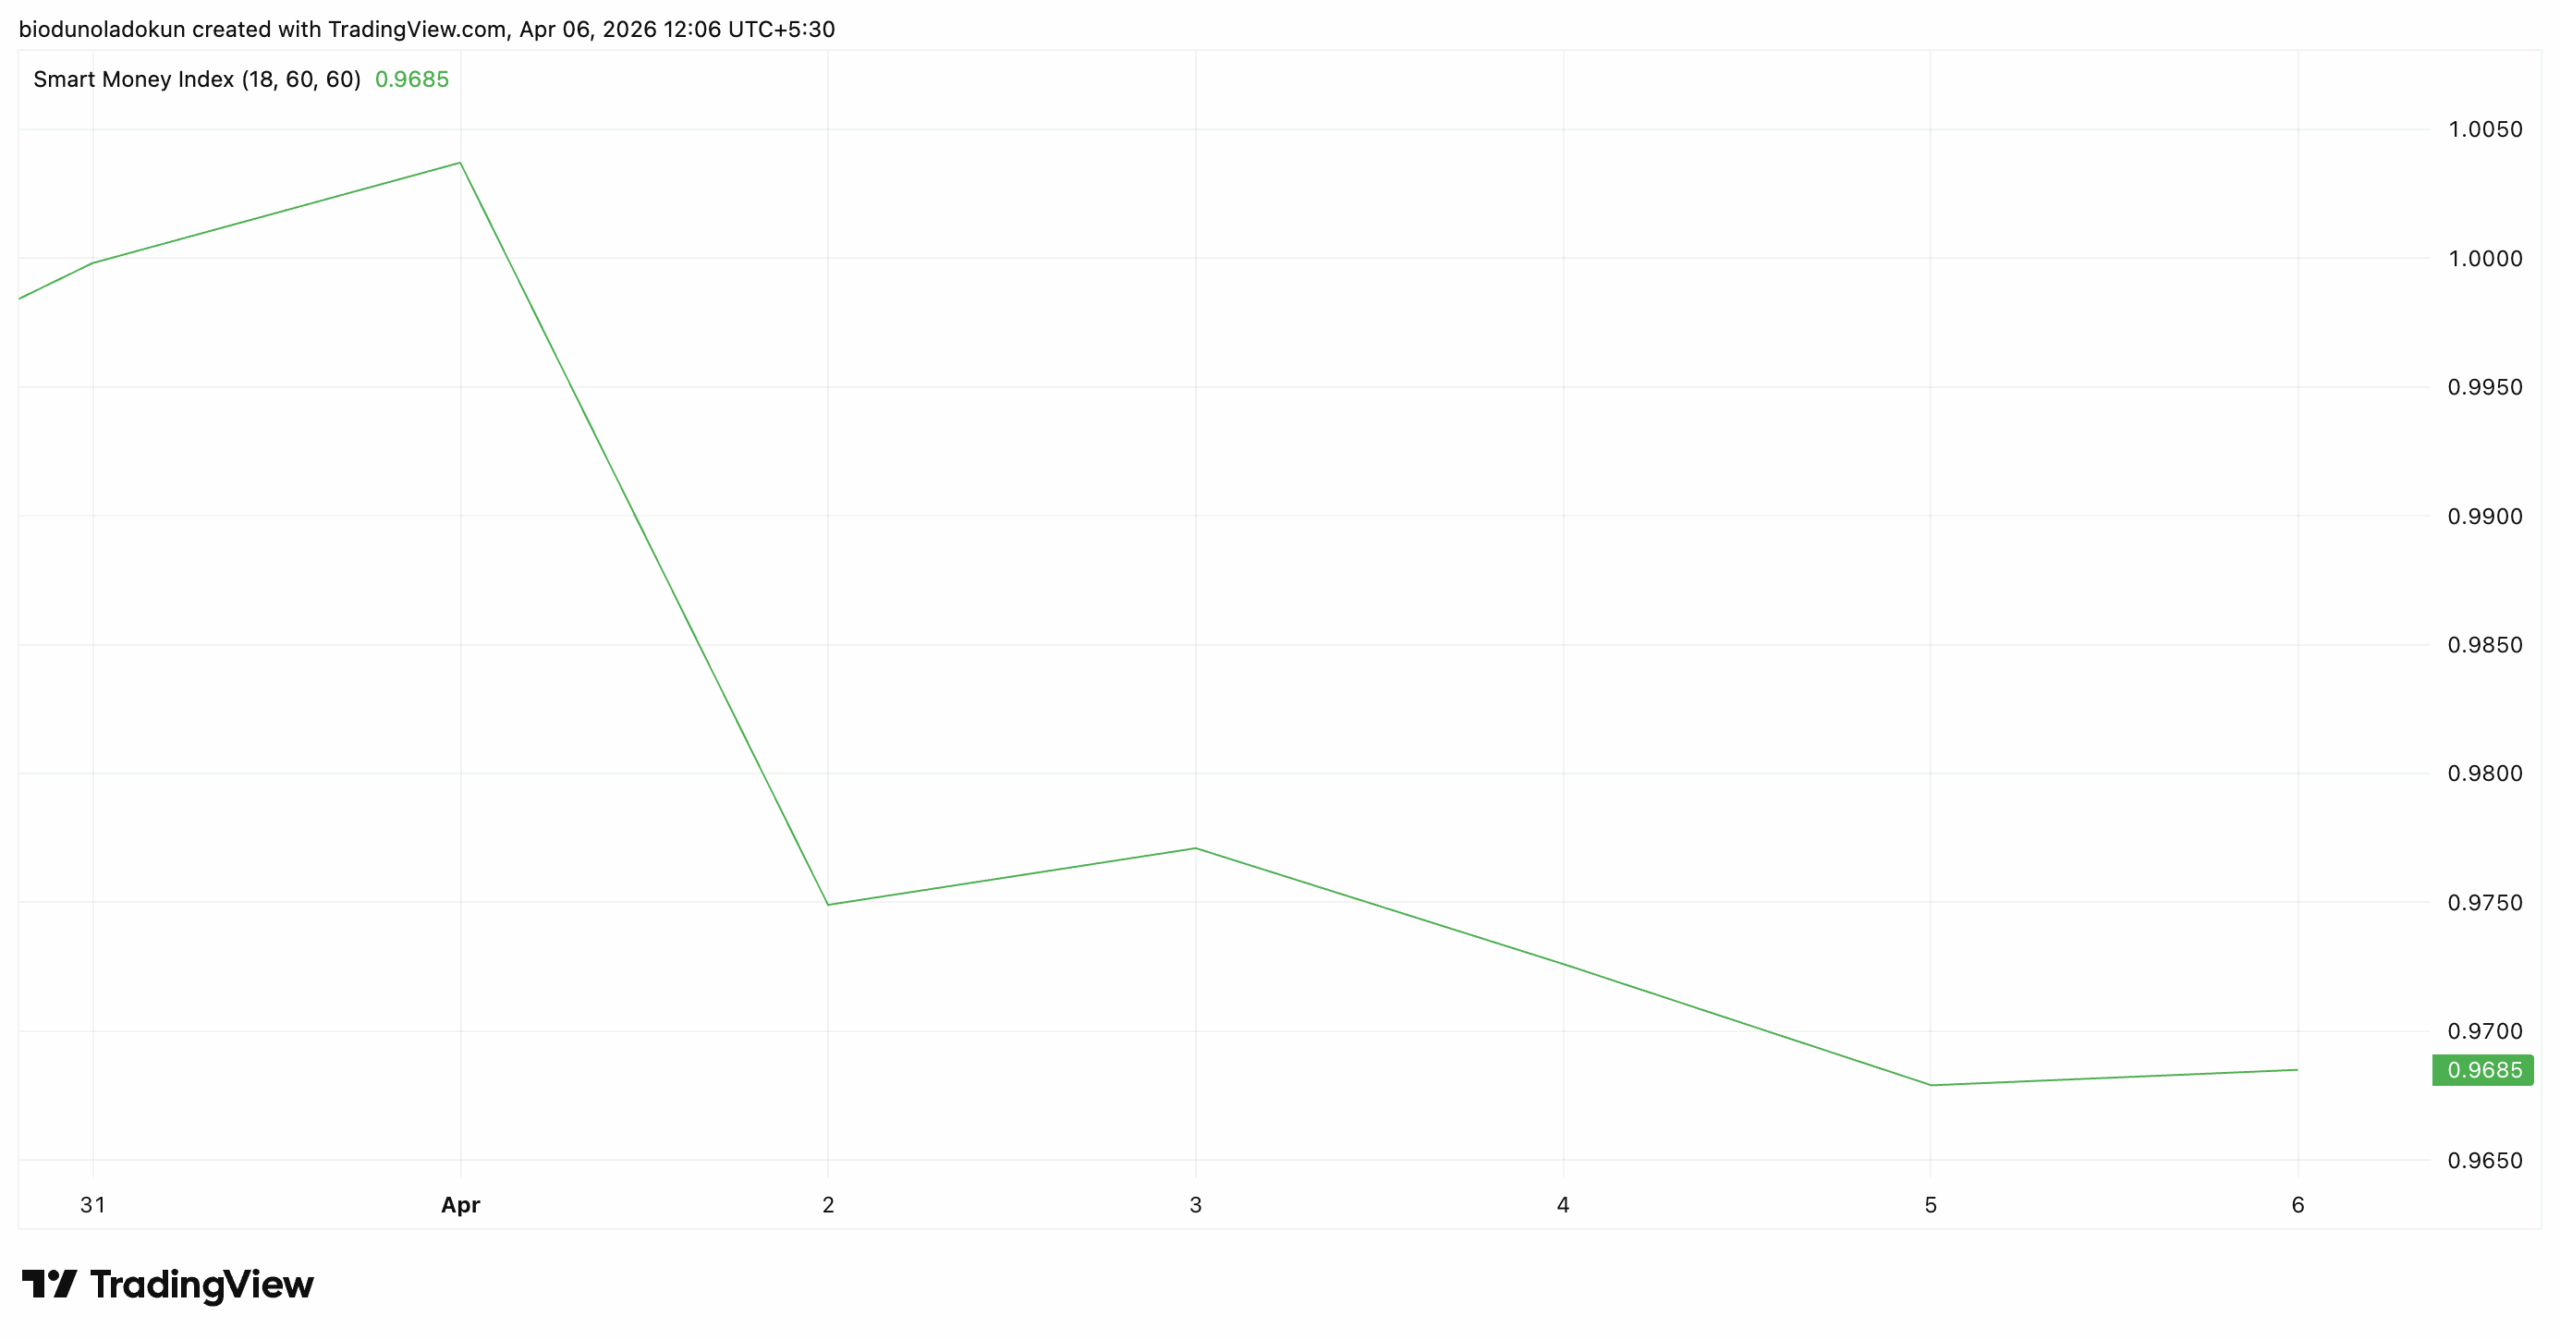
Furthermore, MNT’s plummeting Smart Money Index (SMI) signals the exit of key players from its spot markets. At 0.96 at press time, MNT’s SMI is down 4% since April 1.
The SMI tracks the behavior of institutional investors or experienced traders who understand market trends and timing more deeply.
It measures selling in the morning (when retail traders dominate) versus buying in the afternoon (when institutions are more active).
When it climbs, these key players are accumulating an asset. Conversely, when it plunges, these investors are quietly distributing their holdings.
This pattern of sustained smart money outflow is often a precursor to prolonged price weakness, putting MNT at risk of further downside.
What to Expect?
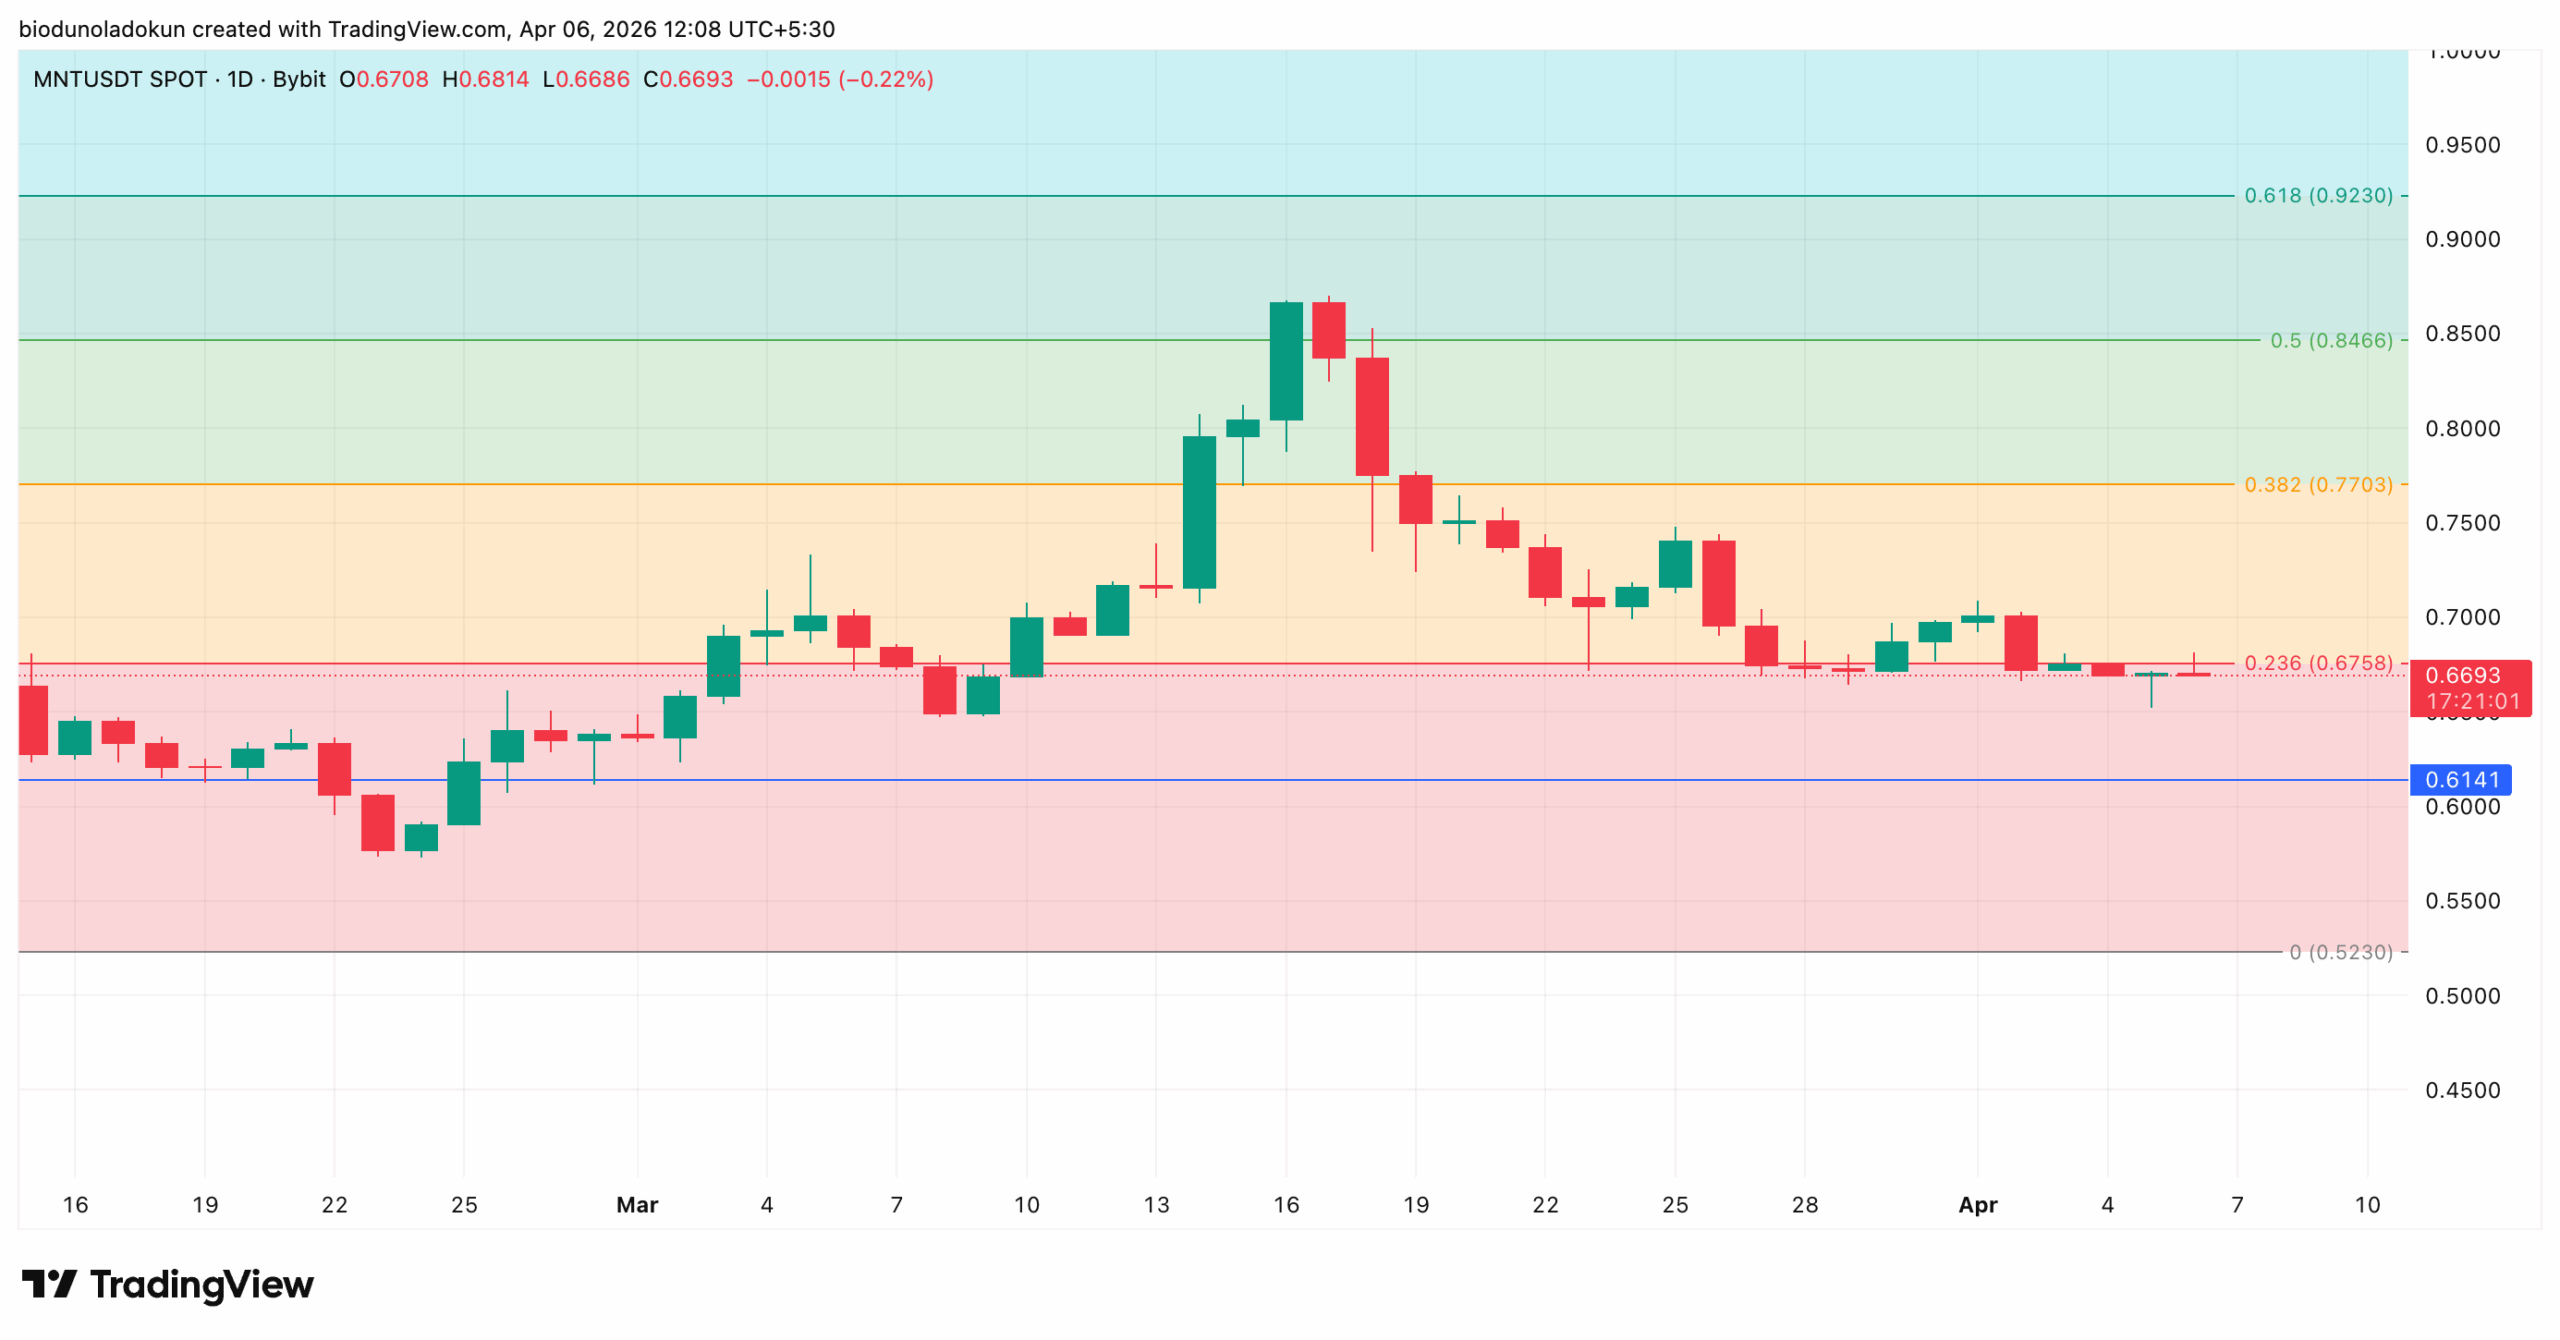
At press time, MNT trades at $0.6693, hovering just below the newly formed resistance at $0.6758. Failure to reclaim that level could see the token retest support at $0.6141.
A breakdown below that floor would expose MNT to deeper losses toward the $0.5230 level.
Disclaimer:
The information provided in this article is for informational purposes only. It is not intended to be, nor should it be construed as, financial advice. We do not make any warranties regarding the completeness, reliability, or accuracy of this information. All investments involve risk, and past performance does not guarantee future results. We recommend consulting a financial advisor before making any investment decisions.
Abiodun Oladokun is a Research Analyst at CCN, where he covers cryptocurrency markets with a focus on on-chain analysis, technical assessments, and emerging trends across decentralized finance (DeFi), real-world assets (RWA), artificial intelligence (AI), decentralized physical infrastructure networks (DePIN), Layer 2s, and meme coins.
Prior to CCN, he served as a Senior On-Chain Analyst at BeInCrypto, producing market reports spanning diverse crypto sectors.
Before that, he conducted technical analysis and market assessments of various altcoins at AMBCrypto, where he also contributed long-form quarterly research papers on DeFi, NFTs, DAOs, and scaling architectures, leveraging on-chain platforms including Messari, Santiment, DefiLlama, and Dune Analytics.
He began his crypto career as a research analyst at SixthSense DAO, developing blockchain forensic tools to trace the history of stolen assets.
Abiodun is a lawyer called to the Nigerian Bar and the founder of Ilé Ijó, a Lagos-based electronic dance music collective.