On the daily chart, HBAR has formed a bullish flag.
A bull flag pattern begins with a sharp, almost vertical price surge—known as the flagpole—as buyers overpower sellers.
This is followed by a pullback, forming a flag-shaped structure with parallel upper and lower trendlines.
After this, the price breaks out of the flag, indicating that the cryptocurrency is ready for another strong rally.
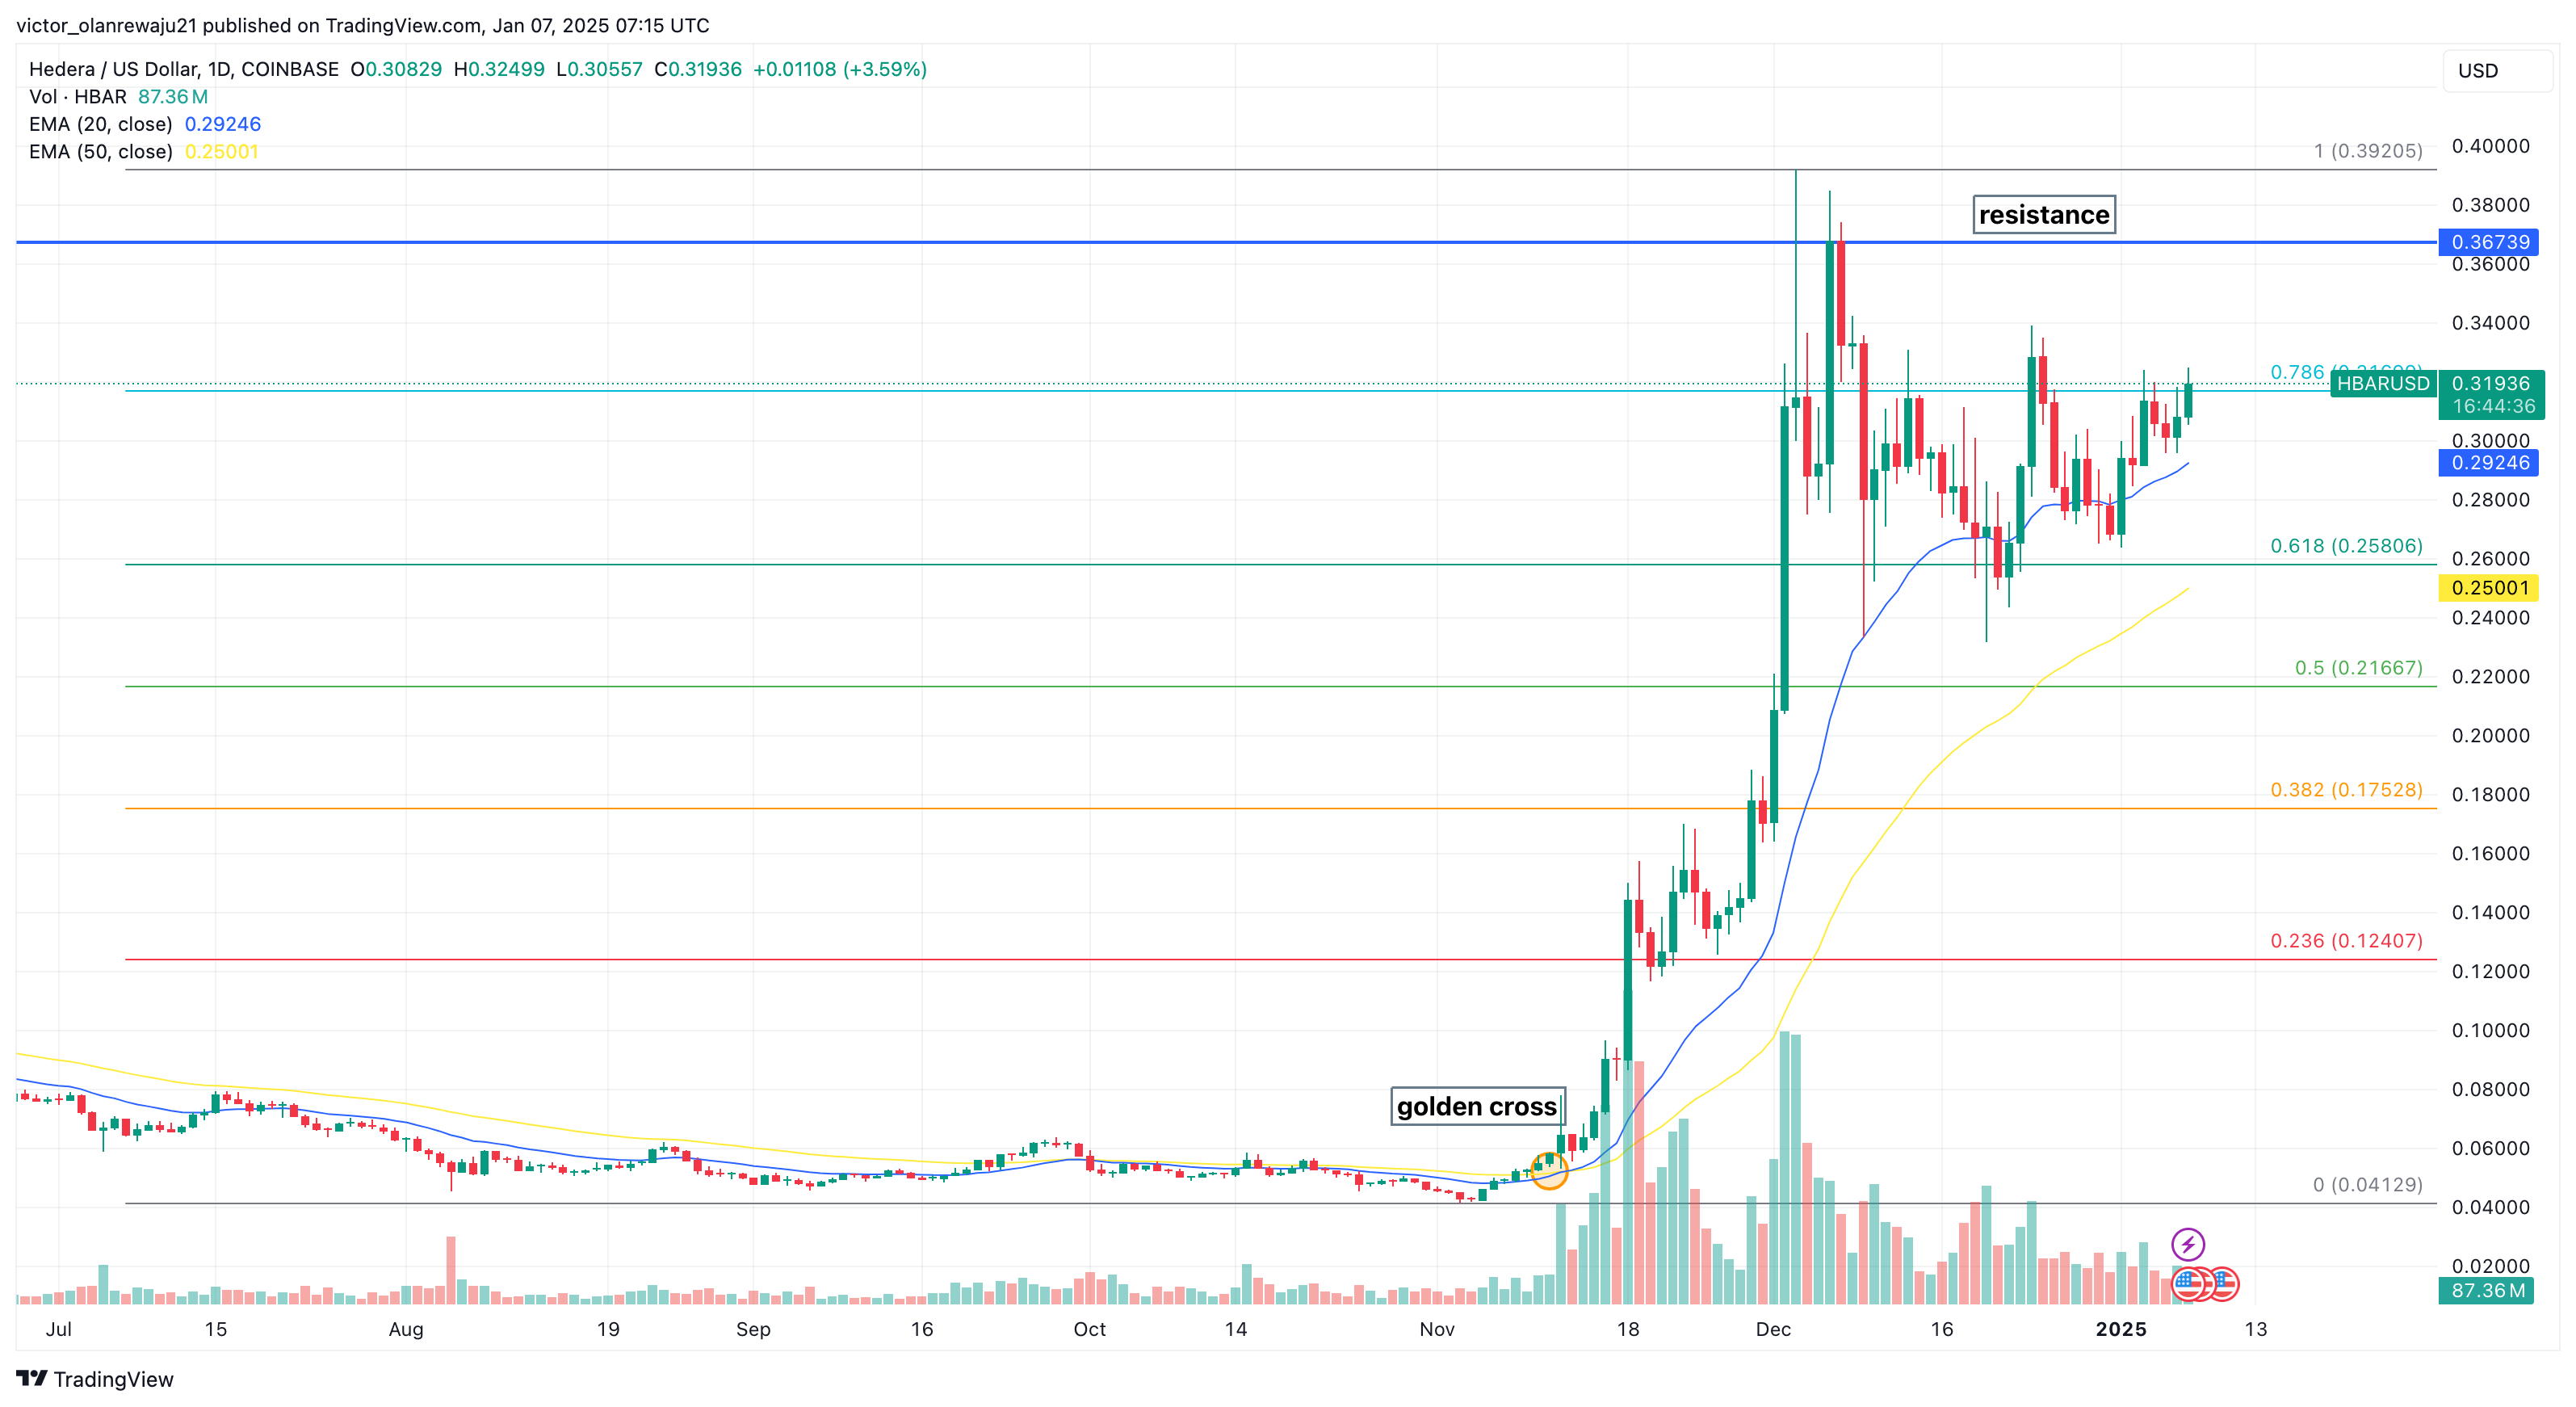
As seen below, HBAR broke out of the flag as soon as the price hit $0.3.
At press time, the price had climbed to $0.32. If the token’s value remains above the flag’s upper trendline, then HBAR is likely to climb further.
HBAR/USD Daily Chart | Credit: TradingView
HBAR Price Prediction: Higher Highs Likely
Still examining the daily chart, the Exponential Moving Average (EMA) also seems to support this thesis.
Typically, the downward crossover of the shorter EMA through the longer one is termed a “death cross.” This indicates the end of an uptrend.
However, HBAR’s daily chart reveals that the 20 EMA (blue) has remained above the 50 EMA (yellow) since Nov. 11, 2024.
This position, termed a “golden cross,” indicates that the altcoin’s price action is still bullish. If sustained, the price might refrain from experiencing a significant correction.
However, several technical indicators, as mentioned above, show that the asset is less likely to experience a drawdown in the short term.
A look at the Fibonacci retracement indicator reveals that HBAR has broken above the 0.786 level. Rising above this level indicates that it has surpassed a major resistance.
Still, the Hedera native token might need to face another resistance at $0.37.
Should buying pressure increase, the next target for the asset could be around $0.40. In a highly bullish scenario, HBAR might inch toward the $0.5 mark.
HBAR/USD Daily Chart | Credit: TradingView
However, this prediction might be invalidated if the price breaks below the lower trendline of the bullish flag.
However, if HBAR slips below the flag’s trendline, the price could retrace to $0.25 or even $0.18, corresponding with key Fibonacci levels.
Disclaimer:
The information provided in this article is for informational purposes only. It is not intended to be, nor should it be construed as, financial advice. We do not make any warranties regarding the completeness, reliability, or accuracy of this information. All investments involve risk, and past performance does not guarantee future results. We recommend consulting a financial advisor before making any investment decisions.
Victor Olanrewaju is a crypto analyst and reporter at CCN with deep roots in on-chain research and technical analysis. His crypto journey began in 2017, but it was the 2020 Uniswap airdrop that sparked a full-time pivot into the space.
With a foundation in copywriting, Victor honed his craft creating high-converting content for leading crypto brokers — most notably an XRP price prediction that ranked #1 on Google during the 2021 bull run.
He later joined AMBCrypto in 2022, where he combined storytelling with technical and on-chain analysis to cover key market narratives.
In 2024, he expanded his expertise at BeInCrypto, collaborating with analysts and using tools like Glassnode, Santiment, and IntoTheBlock to break down Bitcoin and altcoin trends.
At CCN, Victor covers the top cryptocurrencies, memecoins, macro shifts, blending real-time insights with deep-dive metrics.
He holds a Bachelor’s degree in Physics from the University of Ibadan, equipping him to simplify complex data for a wide audience. Follow his work or connect on LinkedIn or X.