DOOD hits new heights after Upbit listing as volume surges | Credit: Derek Fenech
Share
Key Takeaways
Doodles’ crypto price surged to a new high after Upbit listed it.
The altcoin is overbought, but bulls are not slowing down.
Analysis shows that DOOD’s market value could trade higher.
DOOD, the native token of the community-driven media brand Doodles, has soared 135% following its much-anticipated listing on South Korea’s top crypto exchange, Upbit.
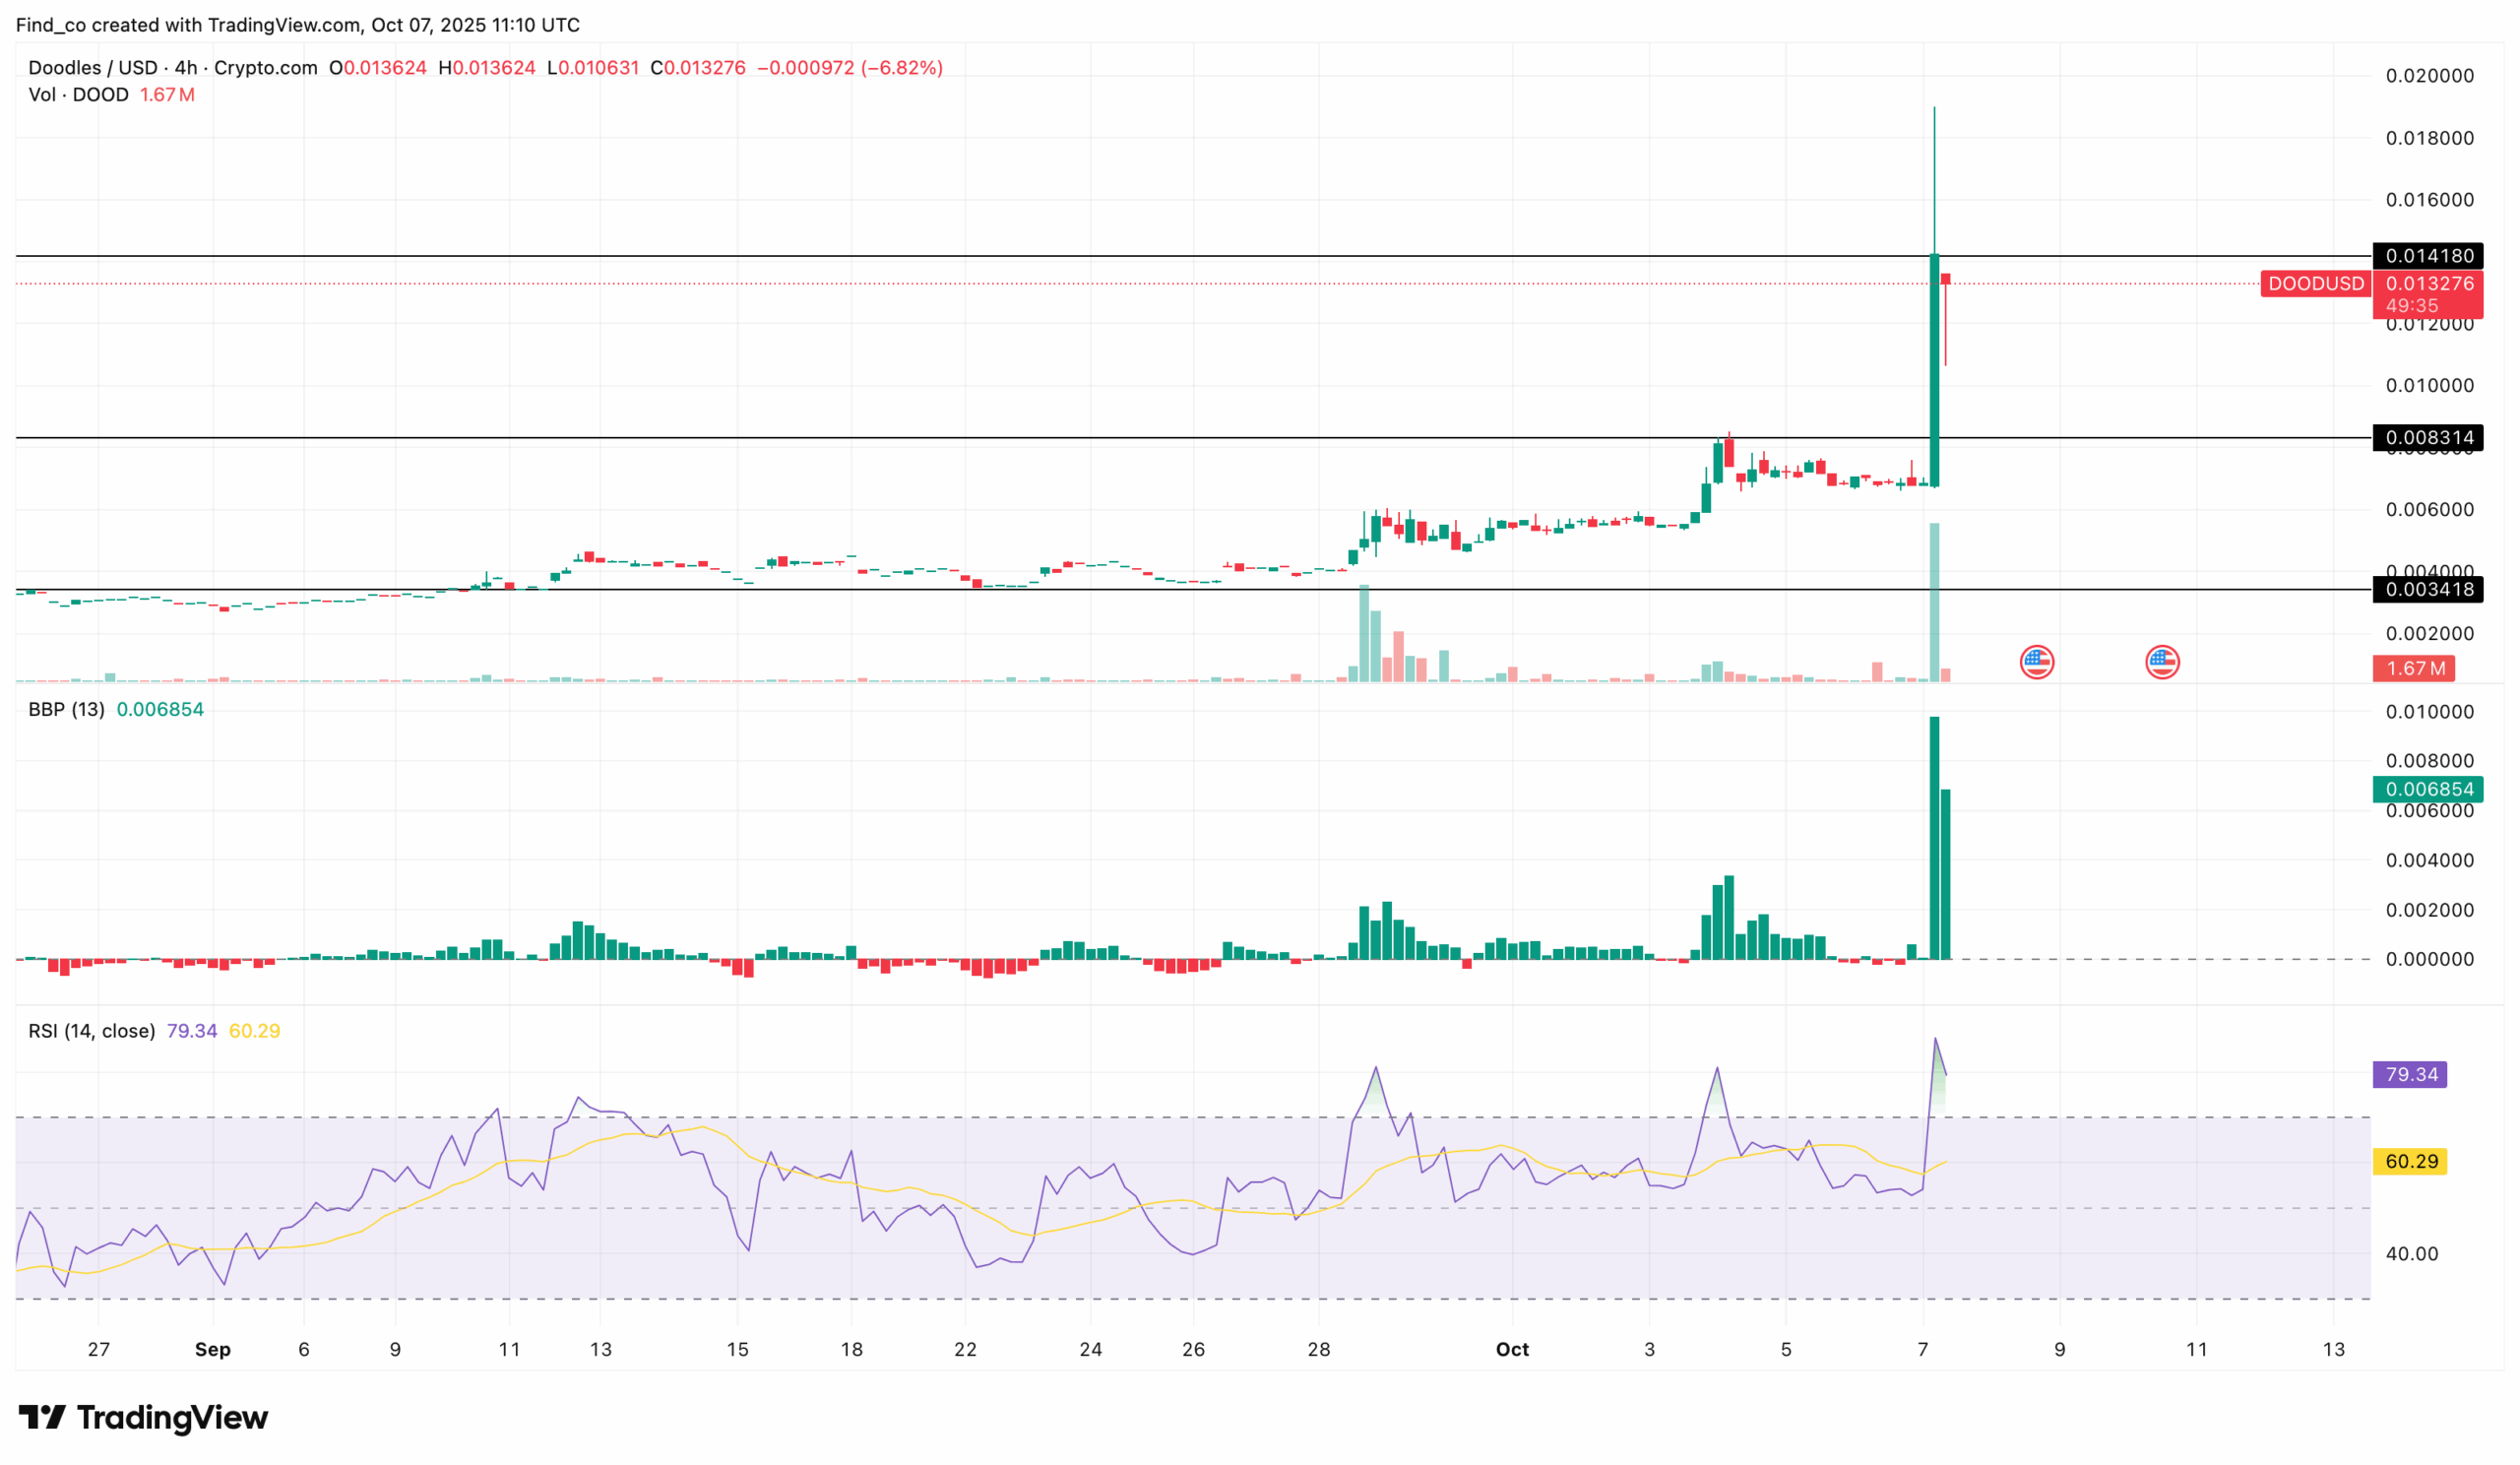
Initially trading around $0.0067, DOOD skyrocketed to $0.019, hitting a new all-time high. The listing sparked a surge in trading volume, igniting what many in the market refer to as another “Upbit effect.”
However, the token has since begun to cool off, with holders locking in profits after the rapid climb. Despite this brief retracement, trading volume remains high.
What does this mean for Doodles’ price?
The ‘Upbit Effect’ Strikes Again
On the 4-hour chart, DOOD’s Relative Strength Index (RSI) now sits at 79.34, easing from its earlier overbought peak of 86.39.
We sometimes use affiliate links in our content, when clicking on those we might receive a commission at no extra cost to you. By using this website you agree to our terms and conditions and privacy policy.
Similarly, the Bear Bull Power indicator supports this sentiment. Although it remains in the green zone, its histogram bars have begun to narrow, a sign that bullish momentum is gradually slowing.
If this retracement continues, DOOD’s price could retest the $0.0010 support, a level that once acted as resistance during its pre-listing accumulation phase.
On the daily chart, the Moving Average Convergence Divergence (MACD) recently flashed a bullish crossover, with the 12 EMA (blue) crossing above the 26 EMA (orange).
The MACD line remains above the histogram, indicating that bulls continue to hold control.
Further strengthening the bullish outlook, the Directional Movement Index (DMI) indicates that the +DMI (green) stands at 66.38, significantly surpassing the –DMI (red) at 3.92.
This significant gap indicates that buyers continue to dominate the market.
Meanwhile, the Average Directional Index (ADX) reads 39.69, confirming that the current uptrend is well-defined. Readings above 25 typically mark strong, directional momentum.
If this remains the same, Doodles’ price might rise to the highest point of the wick at $0.019. A move toward this point would represent a new all-time high for the cryptocurrency.
Still, if the ADX begins to flatten, it could indicate that the rally is losing steam. Hence, this could allow for a brief consolidation before the next breakout.
The Fibonacci retracement levels offer valuable insight into identifying DOOD’s next move.
The 0.618 Fib level, located just below the $0.013 support zone, suggests that if price breaks beneath this area, DOOD’s price could slide toward the 0.382 Fib level at $0.0085.
However, as it stands, bulls are likely to remain in control and push past the $0.015 resistance.
At the same time, the expanding Bollinger Bands (BB), which have touched the DOOD’s price, preach caution.
Disclaimer:
The information provided in this article is for informational purposes only. It is not intended to be, nor should it be construed as, financial advice. We do not make any warranties regarding the completeness, reliability, or accuracy of this information. All investments involve risk, and past performance does not guarantee future results. We recommend consulting a financial advisor before making any investment decisions.
Victor Olanrewaju is a crypto analyst and reporter at CCN with deep roots in on-chain research and technical analysis. His crypto journey began in 2017, but it was the 2020 Uniswap airdrop that sparked a full-time pivot into the space.
With a foundation in copywriting, Victor honed his craft creating high-converting content for leading crypto brokers — most notably an XRP price prediction that ranked #1 on Google during the 2021 bull run.
He later joined AMBCrypto in 2022, where he combined storytelling with technical and on-chain analysis to cover key market narratives.
In 2024, he expanded his expertise at BeInCrypto, collaborating with analysts and using tools like Glassnode, Santiment, and IntoTheBlock to break down Bitcoin and altcoin trends.
At CCN, Victor covers the top cryptocurrencies, memecoins, macro shifts, blending real-time insights with deep-dive metrics.
He holds a Bachelor’s degree in Physics from the University of Ibadan, equipping him to simplify complex data for a wide audience. Follow his work or connect on LinkedIn or X.