Meet the Top 101 in Crypto

Chainlink’s (LINK) Technical Analysis Points to Parabolic Rally in 2025

Published 09 October 2025
Valdrin Tahiri
Authors
Edited by Ryan James
Key Takeaways
  • Chainlink (LINK) trades inside a descending parallel channel.
  • LINK is in the fifth and final wave of its upward movement.
  • Can the LINK price reach a new cycle high in 2025?

Chainlink (LINK) shows signs of strength after weeks of trading inside a descending parallel channel.

The altcoin has reached a critical point where a breakout could signal the end of its corrective phase.

LINK may be poised for a strong year-end, driven by bullish momentum indicators, price action, and a favorable wave count.

Chainlink’s Technical Analysis

The daily time frame shows that the Chainlink price has been falling within a descending parallel channel since August 22.

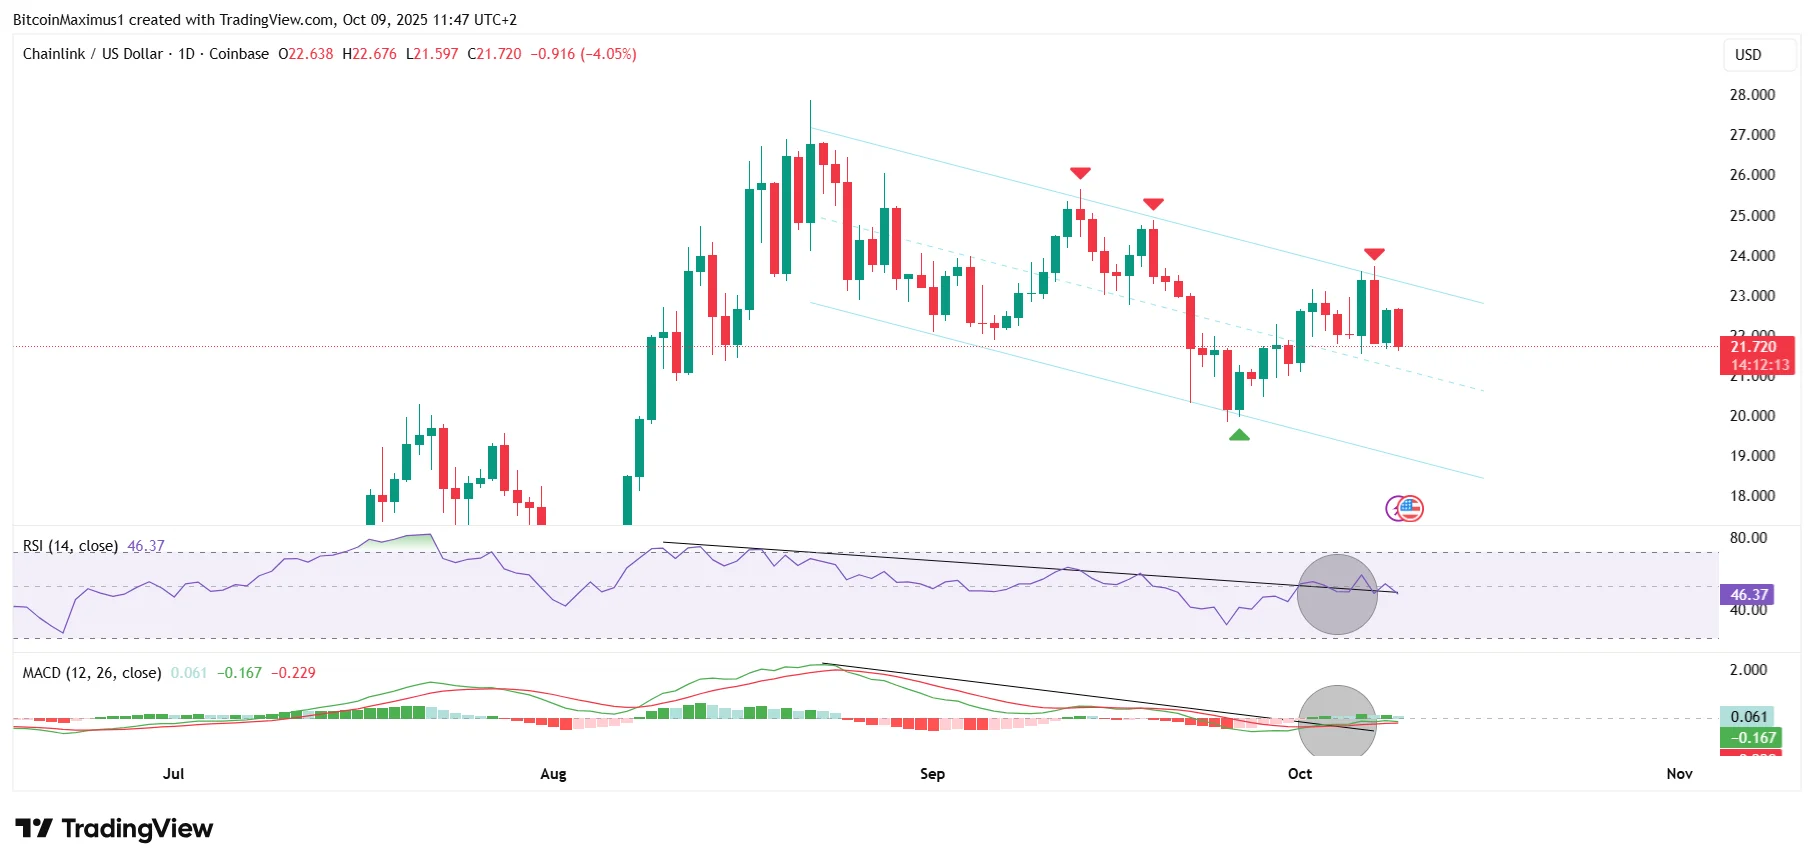
After hitting a low of $19.83 at the channel’s support trend line (green icon), Chainlink began an upward movement and is breaking out from the channel today.

A successful breakout will confirm that the correction has ended and a new upward movement toward new highs is likely.

Get These Top Crypto Casino Offers Now!
Sponsored
Disclosure
Opened in 2023
Promotions
200% deposit bonus up to 20,000 USDT + up to 100 FS (promo code: CG100)
Coins
Tether Bitcoin Ethereum USD Coin TRON +7
Opened in 2021
Promotions
Casino No Wagering 100 Free Spins
Coins
Bitcoin Tether USD Coin Ethereum Solana +11
Opened in 2018
Promotions
500% Welcome Bonus up to $90,000 + 100 Free Spins
Coins
Bitcoin Ethereum Litecoin Tether Dogecoin +3
Show More

While LINK may fall to the channel’s support once more, an immediate breakout is more likely.

This is because Chainlink’s price currently trades in the upper portion of the channel, creating a bullish engulfing candlestick.

Combined with the three previous breakout attempts, the price action suggests a breakout is imminent.

Momentum indicators also give a bullish Chainlink price prediction for October and beyond.

LINK Channel
LINK/USDT Daily Chart | Credit: TradingView

The Relative Strength Index (RSI) is above 50, and the Moving Average Convergence/Divergence (MACD) has made a bullish cross (black circle).

Additionally, the indicators broke out from their bearish divergence trend lines (black), confirming the end of the correction.

Since an RSI and MACD breakout often precedes a price breakout, Chainlink will likely follow soon.

Chainlink Correction Over?

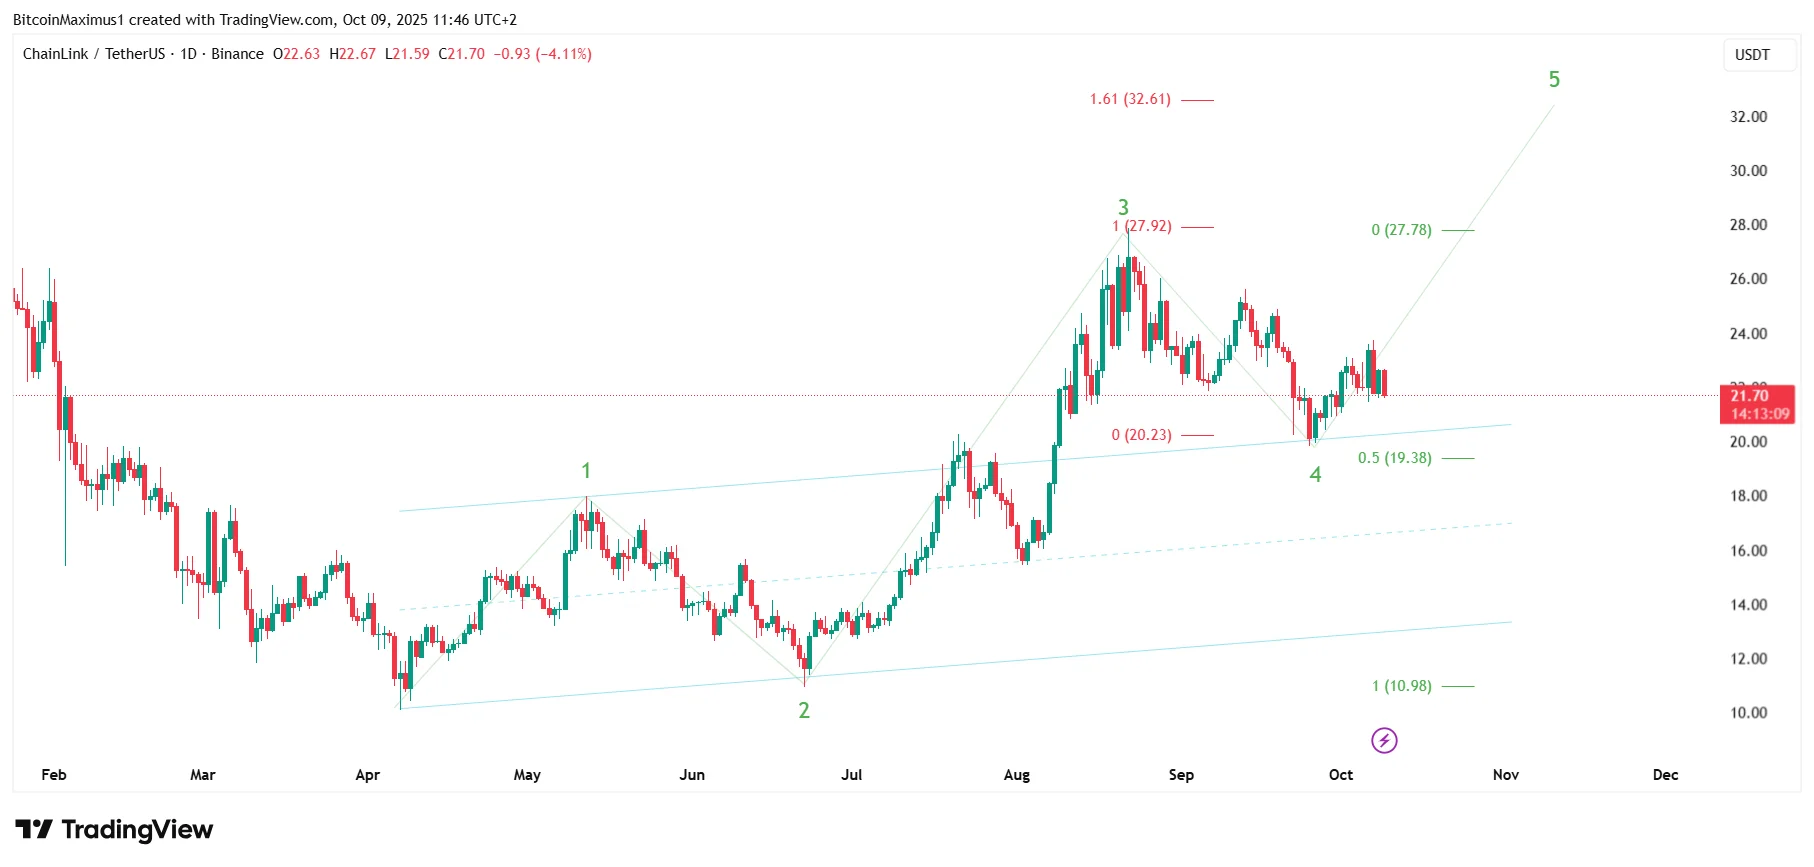
The wave count confirms the daily time frame price action findings, suggesting that a massive breakout is imminent.

According to the count, LINK has completed wave four in a five-wave upward movement (green), reaching a new cycle high.

Wave four completed a textbook fourth-wave pullback, hitting the 0.5 Fibonacci retracement support level and the resistance trend line of the previous channel.

LINK Wave Count
LINK/USDT Daily Chart | Credit: TradingView

Both often occur in wave four, increasing the confidence that this is the correct count.

Moreover, sufficient alternation between waves two and four is another sign that the count is accurate.

The first target for the top of wave five is at $32.61, created by the 1.61 external Fibonacci retracement resistance level of wave four.

Bullish October Prediction

Chainlink’s prediction for October and the rest of 2025 is bullish.

LINK is likely in the fifth and final wave of its upward movement, which will take it to a new cycle high. 

Chainlink’s rally will likely become parabolic once the price breaks out from its descending parallel channel.

Disclaimer: The information provided in this article is for informational purposes only. It is not intended to be, nor should it be construed as, financial advice. We do not make any warranties regarding the completeness, reliability, or accuracy of this information. All investments involve risk, and past performance does not guarantee future results. We recommend consulting a financial advisor before making any investment decisions.
Valdrin Tahiri

Valdrin Tahiri is a cryptocurrency analyst and reporter at CCN, specializing in technical analysis with a focus on Elliott Wave theory, on-chain metrics, and fundamental research. He brings over seven years of experience in the crypto space as both a trader and writer.

He discovered cryptocurrencies in 2017 while earning his MSc in Financial Markets at the Barcelona School of Economics, which sparked a deep interest in blockchain and market dynamics. Since then, he’s contributed to top crypto outlets like BeInCrypto and CoinGape.

Valdrin also served as Community Manager of BeInCrypto’s Telegram group for three years, helping grow it into one of the largest crypto communities worldwide. His expertise in market structure and price patterns allows him to break down complex trends into clear, actionable insights.

He’s published thousands of articles covering altcoins, Bitcoin cycles, and macro trends.

Related

Survey Icon
Help us improve
1 of 4
Is this your first time here?
What brought you here today?
What are you most interested in?
Would you be interested in:
Thank you icon
Thank you for your feedback!
DMCA.com Protection Status