XRP Price Could Soar More than 60% Based on Technical Signals: Analyst

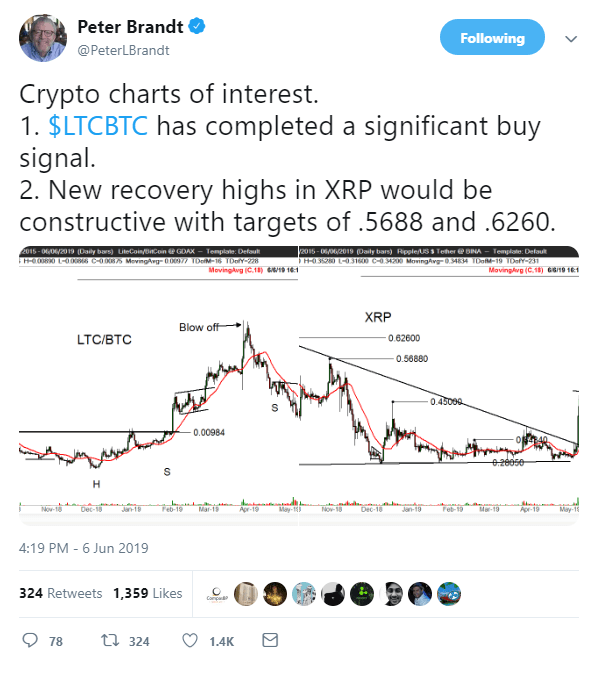
Peter Brandt took to Twitter to share his bullish view on Ripple’s price action. He emphasized target prices for Ripple at 0.5688 and 0.6260. | Source: Shutterstock
By CCN.com: On June 6, author and chartist Peter Brandt (@PeterLBrandt ) took to Twitter to share his bullish view on Ripple’s price action. In his tweet, he mentioned two cryptocurrencies flashing bullish signals against Tether US (USDT): Litecoin and Ripple. While he did not specify the targets for Litecoin, he emphasized two target prices for Ripple, which are 0.5688 and 0.6260.

Peter Brandt is one of the most respected figures in the crypto community on Twitter. While he runs a paid group on his website, he shares some of his insights with his followers. His account has been active since February 2011 and he has amassed over 281,000 followers.
The Ripple Ultra Bullish Scenario
In trading and investing, there’s a saying that goes, “the longer the base, the higher the space.” This means that the more time an asset spends in accumulation or base building, the higher the bullish price targets. This happens because the smart money who built the base at the bottom would need to exponentially pump prices to ensure that profits are maximized when they begin to distribute or dump positions.

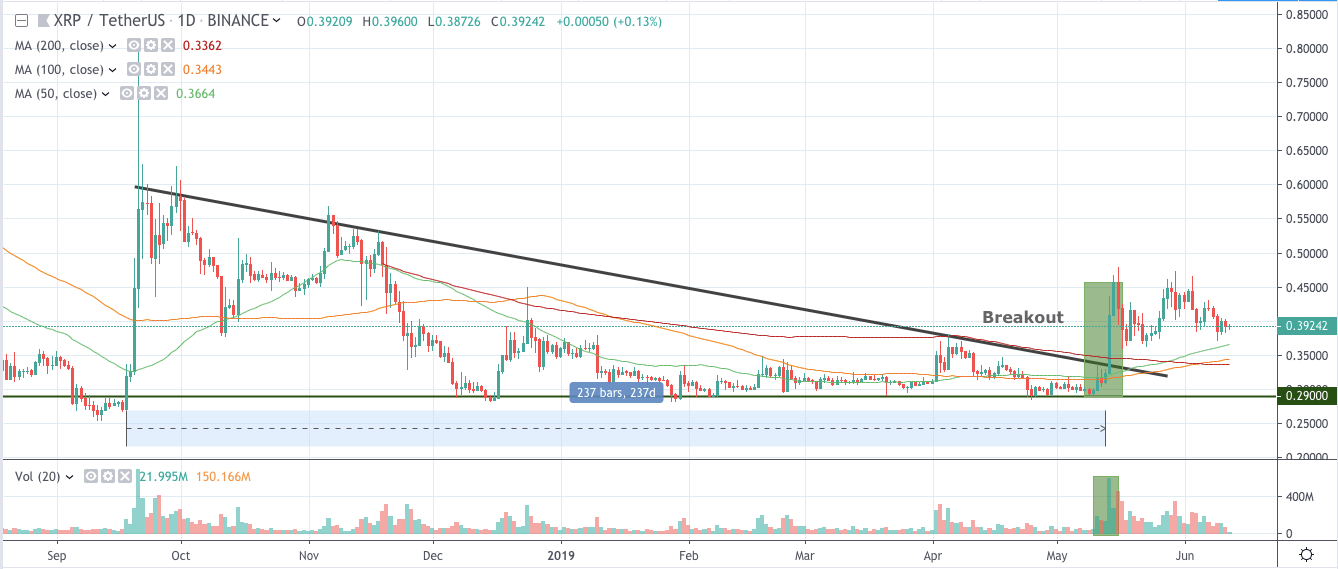
In Ripple’s case, the accumulation inside the large descending triangle lasted 237 days. That’s almost eight months of trading within the pattern.
That’s why when the market broke out of the pattern on May 14, Ripple skyrocketed from an open of 0.32385 to a close of 0.409. The breakout was pushed by tremendous volume. Looking at the XRP/USDT chart, the volume registered on May 14 is the pair’s second largest on Binance. With buyers returning in droves, Ripple’s rally lasted until May 16 when the cryptocurrency surged to 0.479.
XRP Flashed Multiple Bullish Signals After the Breakout
In technical analysis, a descending triangle pattern is often associated with bearish price action . However, rules that work in other assets don’t often apply in crypto. Case in point is Ripple’s descending triangle. Ripple’s value could have floundered because of this bearish pattern, but it did the exact opposite.

The target of a descending triangle breakout is often the highs of the pattern. In Ripple’s case, that’s 0.626 – as Peter Brandt predicted.
This assessment could be sound for several reasons.
First, we can see Ripple printing a large bull flag on the daily chart. This is a continuation pattern which suggests that the market may resume its ascent after the consolidation. On top of that, we just saw a golden cross between the 100-day moving average (MA) and the 200-day MA.
Lastly, the bullish crossover puts all of our three MAs in an ideal alignment. The 50-day MA is on top of the 100-day MA and the 100-day MA is above the 200-day MA. This setup tells us that Ripple is bullish in the short-term, medium-term, and long-term.