Why Litecoin Will Skyrocket 140% in Less Than 3 Months & Hit $220

The Litecoin price will surge 140% to $220 in less than three months thanks to a crucial catalyst that promises to fundamentally reshape the LTC market. | Source: Shutterstock
By CCN.com: The Litecoin price has enjoyed a breakneck bull run in 2019, launching the cryptocurrency nearly 200 percent higher in less than six months. But while cautious investors might be tempted to take their profits and run, a crucial upcoming event could send Litecoin another 140% higher over the next three months, enabling LTC to eclipse the $220 mark for the first time in more than a year.
The trigger from this mammoth ascent? Litecoin’s long-awaited “halvening ,” which will slash block rewards by 50%, from 25 LTC to 12.5 LTC.
Historically, such halvenings (or “halvings”) have proven to be bullish catalysts for proof-of-work cryptocurrencies. As inflation decreases, investors anticipate a comparable increase in price.
Litecoin Flashes Multiple Bullish Patterns
Litecoin’s halving won’t happen until around August 6 , yet the altcoin’s price has already tripled in 2019. Even so, the cryptocurrency’s technical picture suggests the rally still has plenty of momentum.
Currently, it’s struggling to take out resistance at $100, but the bulls appear determined to pierce this level. On the daily chart on Coinbase, you can easily see the formation of an ascending triangle pattern.
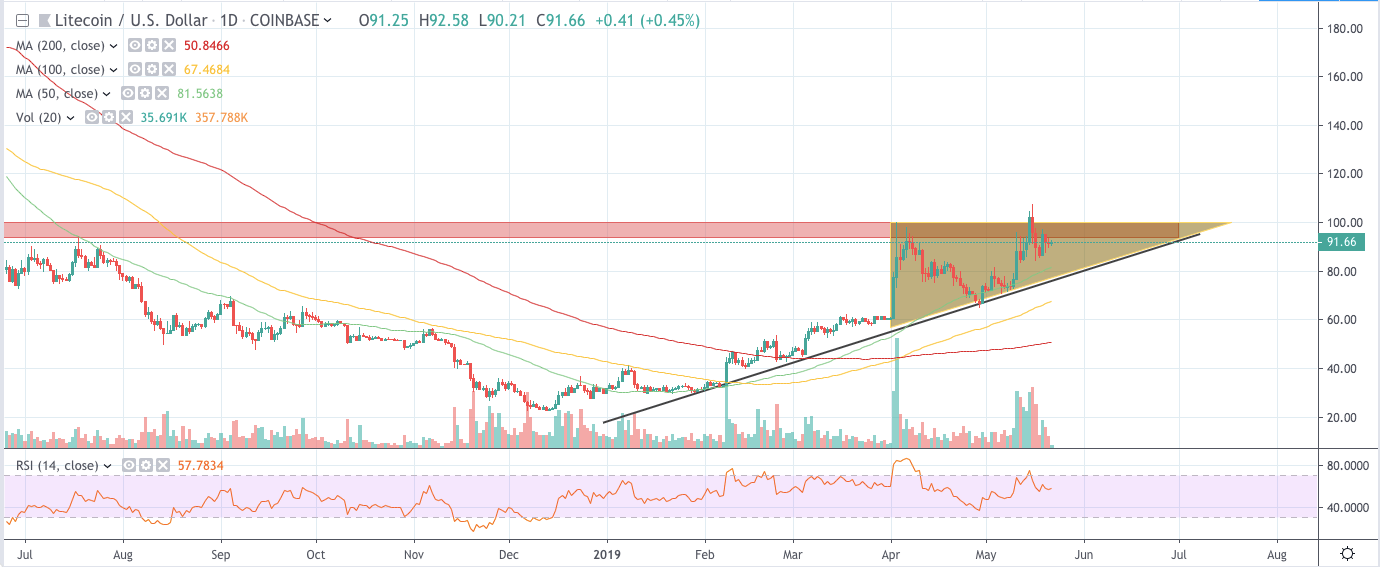
The triangle is a continuation pattern, which indicates that the market is very likely to resume its uptrend once consolidation is over. As you can see, the diagonal support is still intact.
In addition, the three moving averages are in perfect bullish alignment. The 50-day MA is above the 100-day MA, and the 100-day MA is on top of the 200-day MA. These signals tell us that Litecoin’s uptrend remains healthy.
On top of the ascending triangle, Litecoin is also painting a massive inverse head-and-shoulders pattern on the weekly chart. This pattern has been under construction for almost a year now. That’s a long time to build a base in the cryptocurrency world.
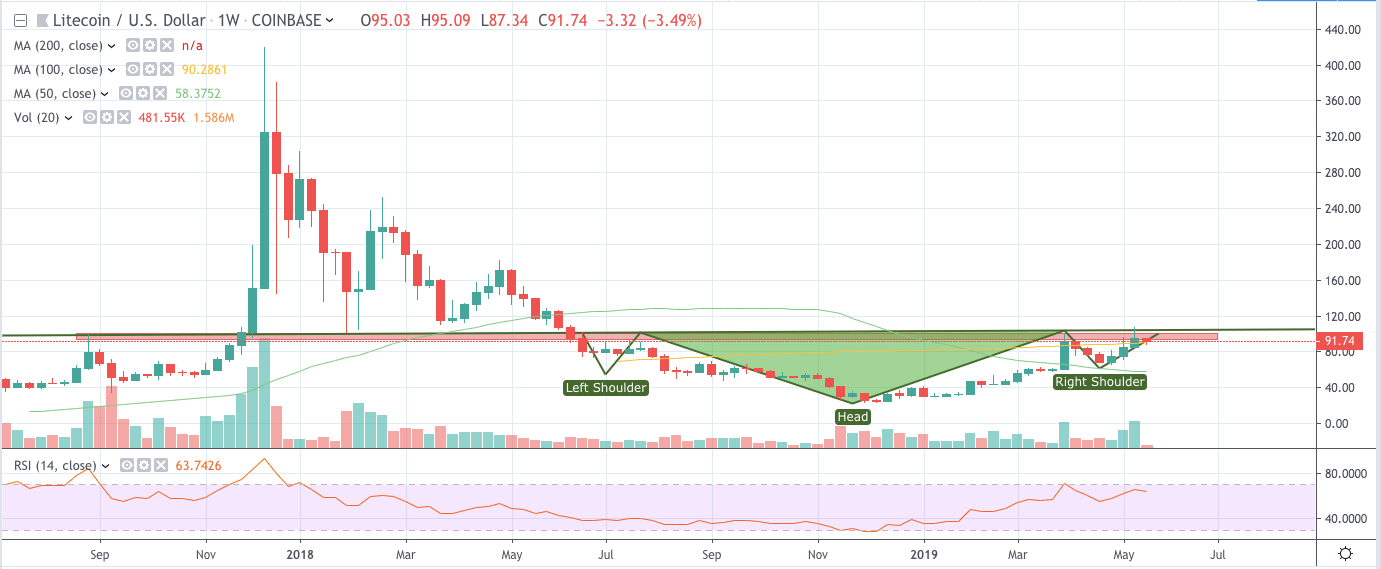
The neckline of this pattern is $100. This means that fireworks will begin once bulls convincingly take out this level. Using the height of the pattern to estimate a target, a breach of $100 will likely send Litecoin to $175.
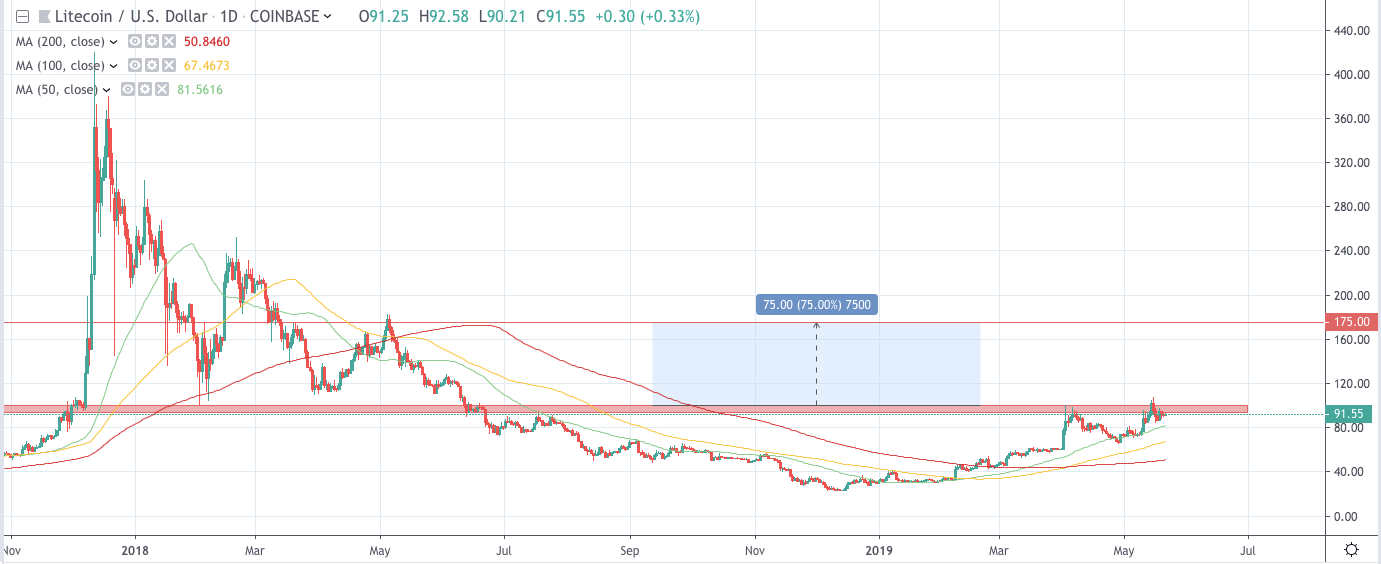
LTC Price Won’t Face True Resistance Until $220
Breakout from this pattern signifies the end of the Litecoin’s long-term downtrend. This will attract breakout traders, trend followers, and others who were staying on the sidelines during this long bear winter.
The bullish momentum generated will make it possible for Litecoin to pierce $175 quickly. That’s because the only strong resistance from the macro perspective above $100 is $220.
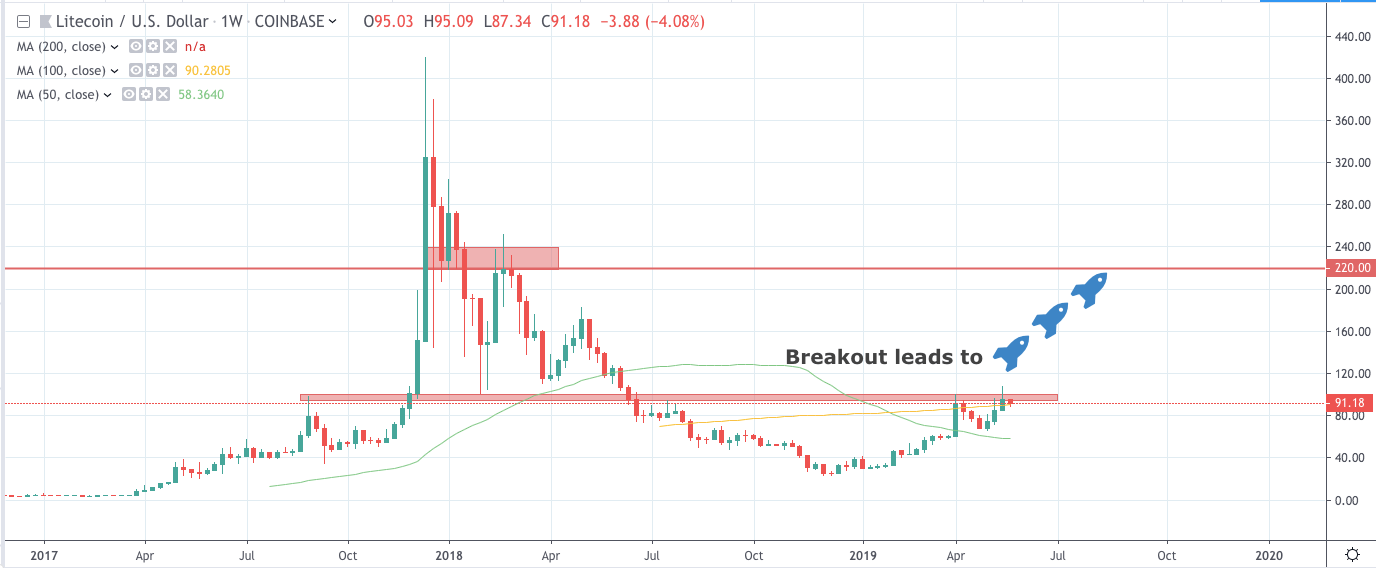
Of course, we expect Litecoin to spend some time consolidating around $175 before it can ascend to $220. At that point, however, the bullish sentiment is likely to be very strong. This means that buyers are likely to front-run each other just like they are in bitcoin right now.
With the “halvening” just around the corner, bulls should expect Litecoin to trade as high as $220 before August 2019.
Disclaimer: The views expressed in the article are solely those of the author and do not represent those of, nor should they be attributed to, CCN.com.