The stock market’s impressive April rally has already run out of steam. What’s next could be uglier than what we saw in March. | Image: AP Photo/Richard Drew
Share
It looks like the stock market has hit the ceiling.
There’s some debate as to whether or not the S&P 500 will retest March lows.
No matter what, most are expecting the market to be fruitless over the next few months.
It seems the relief rally is finally coming to an end after the stock market delivered record gains in April despite mounting concerns about the economic impact of coronavirus. The dramatic spike that followed March’s 30% losses has been attributed to investors’ willingness to look past the near-term coronavirus damage.
Market Gains Driven By “Fear Bubble”
But Stifel’s Barry Bannister says it’s more likely the result of a “fear bubble.”
Covid-19 is a great tragedy but also a ‘fear bubble’, the bursting of which has lifted stocks near-term despite long-term damage caused by economic decisions during the bubble
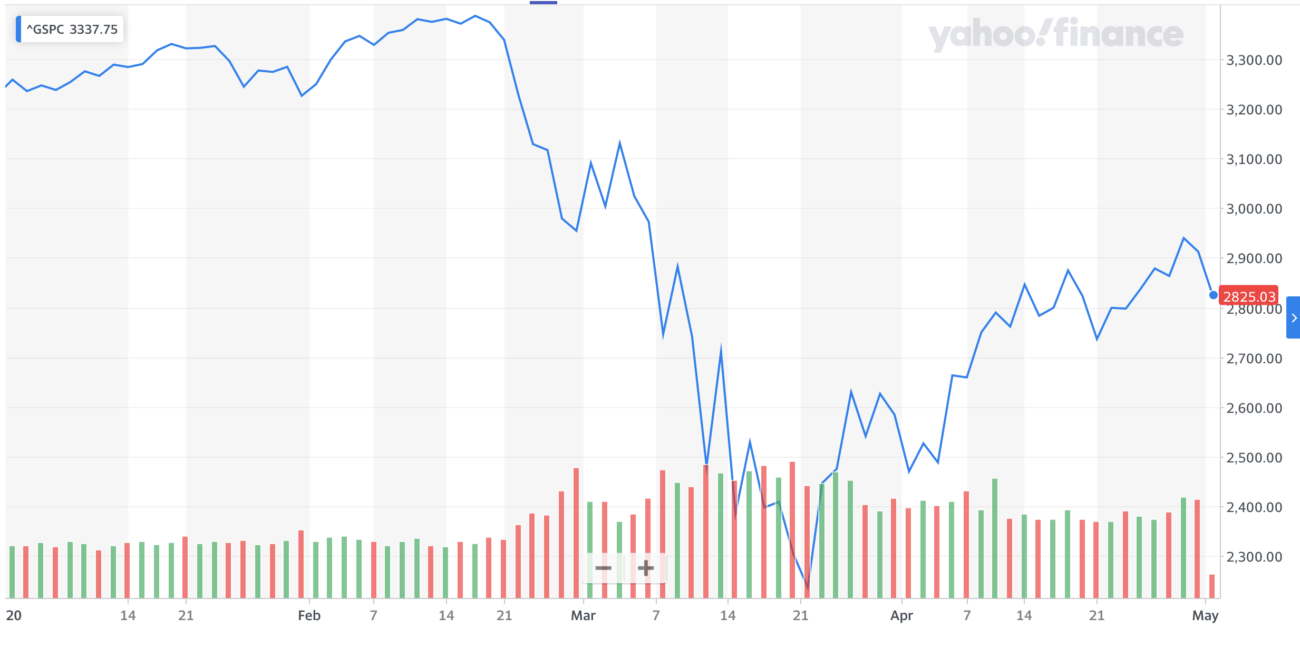
Bannister accurately predicted the S&P 500’s monumental April rise days before it bottomed at 2,237. But he believes now that the market has absorbed the Federal Reserve’s massive stimulus-response, it’s time to take profits. Bannister doesn’t see the index making its way above 2,950 anytime soon.
The S&P 500 can’t go any higher without more Fed action. | Source: Yahoo Finance
He believes there are two ways for the market to climb higher— positive economic data or another major move from the Fed. The former looks extremely unlikely anytime soon, while action from the Fed is a distinct possibility. But for the U.S. central bank to make a move, the macroeconomic climate would have to worsen— perhaps through deflation.
Bannister’s prediction isn’t surprising. This quarter we’ve seen company after company caution investors about the turbulence ahead. Despite trillions of dollars worth of stimulus spending, the picture of the U.S. economy looks worse with each passing week. The stock market can’t return to its former highs amid this kind of uncertainty.
Is a Stock Market Crash Coming?
But the question remains: are we looking at months of sideways trading, or is the stock market due for another epic crash? The answer to that depends on who you ask.
Jeff Hirsch of Probabilities Fund Management says historical data suggest we’ve already seen the bottom. He believes the bottom of a bear market correlates with a peak in jobless claims. According to his data, that’s the case in the bear markets of 1970, 1974, 1982, 1990, 2001, and 2009.
A peak in unemployment claims has accompanied the bottom of previous bear markets. | Source: MarketWatch
The most recent jobless claims report was nothing to sneeze at, but it was a distinct decline from where it was just a few weeks ago. Because of this, Hirsch doesn’t see the market going lower than it did on March 23.
But Hirsch’s predictions could prove to be overly optimistic, especially if coronavirus isn’t eventually eradicated.
According to a new study by the University of Minnesota, the coronavirus outbreak will probably continue for 18 to 24 months. The researchers believe 60%-70% of the population will need immunity in order to put an end to the pandemic.
Market researcher James Bianco has warned that the rally we’ve seen in April is setting the market up for another steep fall:
I understand the market has been up a lot since the March low. But what I see in the market is a retracement rally that looks very similar to the first type of rallies that you get in protracted bear markets
Bianco says he sees the market retesting its previous lows by the end of the summer.
Indeed, Biano’s belief that the stock market rally is setting investors up for a big fall aligns with historical data as well. All of the most notorious asset bubbles of the past saw a sharp rally as investors tried to claw back gains before the stock market fell off a cliff.
Timing the Bottom
So, how will we know when the market is on stable ground again? That’s anyone’s guess. But market timers look to the Fibonacci retracement level for clues on the stock market’s direction. Fibonacci levels mark levels of support that, if crossed, indicate that the market could continue to move lower.
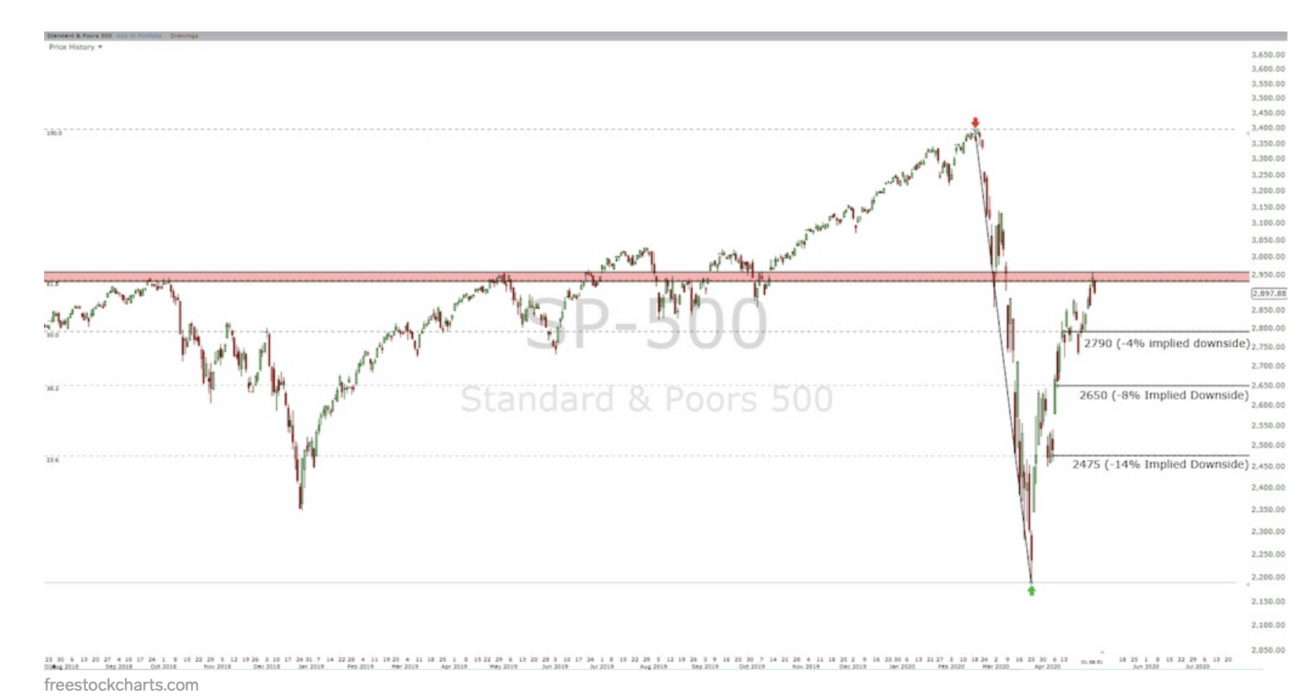
Fibonacci levels are a useful way to gauge whether the market will keep falling. | Source: Business Insider
The first milestone for the S&P 500 is the 61.8% Fibonacci level or 2,933, which the market passed on Thursday. Now, traders should be watching whether the S&P 500 can find support at any of the next milestones—2,790, 2,650, and finally 2,475. If not, we’d expect to see a retest of March’s lows.
Disclaimer: The views expressed in this article represent the author’s opinion and should not be considered investment advice from CCN.com. The author holds no position in the above-mentioned securities.
Laura has been working as financial journalist covering US markets for more than a decade. Her work can be found in a wide variety of publications including Yahoo Finance, InvestorPlace, Nasdaq and Benzinga. Contact her at [email protected], see her LinkedIn profile here.