While Wall Street’s best days tend to occur during “bear market rallies,” the S&P 500’s best months have been a leading indicator of market upswings. | Source: MISHELLA/Shutterstock.com
Share
The S&P 500 just recorded its second-best “month” ever, rising 22.3% in 20 trading days.
The only time it rose more aggressively was immediately after the stock market bottomed in 2009.
This historical indicator suggests the stock market is on the verge of a major rally.
The stock market has been flashing all kinds of ugly parallels to 2008 since the coronavirus pandemic sparked a historic sell-off two months ago. The S&P 500 just triggered another financial crisis echo, but this time, the indicator is ridiculously bullish for Wall Street.
S&P 500 Records Best ‘Month’ in 11 Years
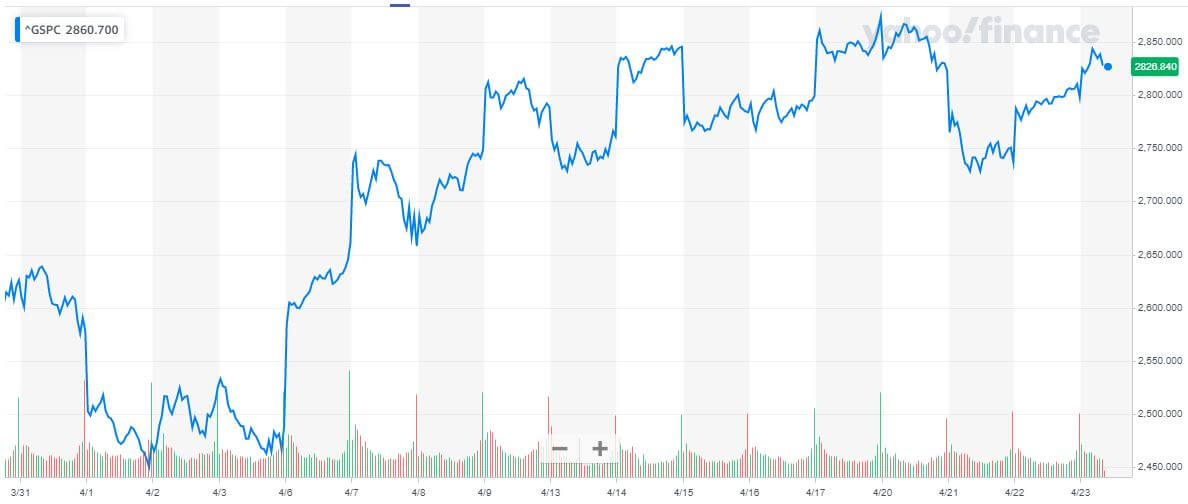
As a new report from Strategas Research reveals, the S&P 500 just recorded its second-best 20-day run ever. The index surged 22.3% during that period, trailing only its 23.5% surge in late March and early April 2009.
The S&P 500 just recorded its second-strongest 20-day move in history. | Source: Yahoo Finance
Why is that significant? March 2009 is when the stock market finally bottomed following the crash that began in 2008.
That’s more than just an interesting factoid. It’s an insanely bullish indicator for a stock market that has been rocked by volatility amid an unprecedented economic crisis.
Why History Says This Is Bullish for the Stock Market
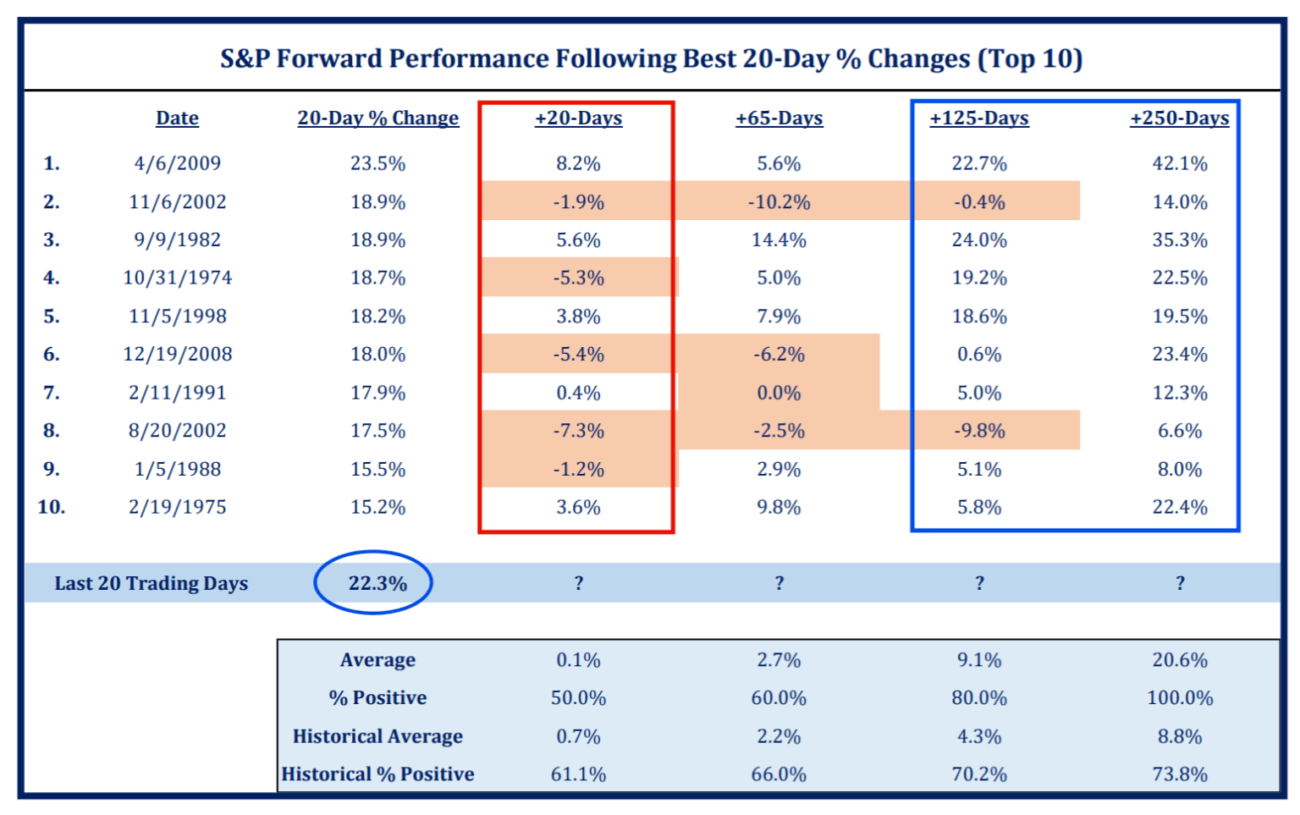
This chart shows what happened following the S&P 500’s strongest 20-day moves. (There are roughly 20 trading days in a month.)
The stock market has gained an average of 20.6% in the years following the S&P 500’s ten strongest 20-day moves. | Source: Strategas Research via the Bahnsen Group
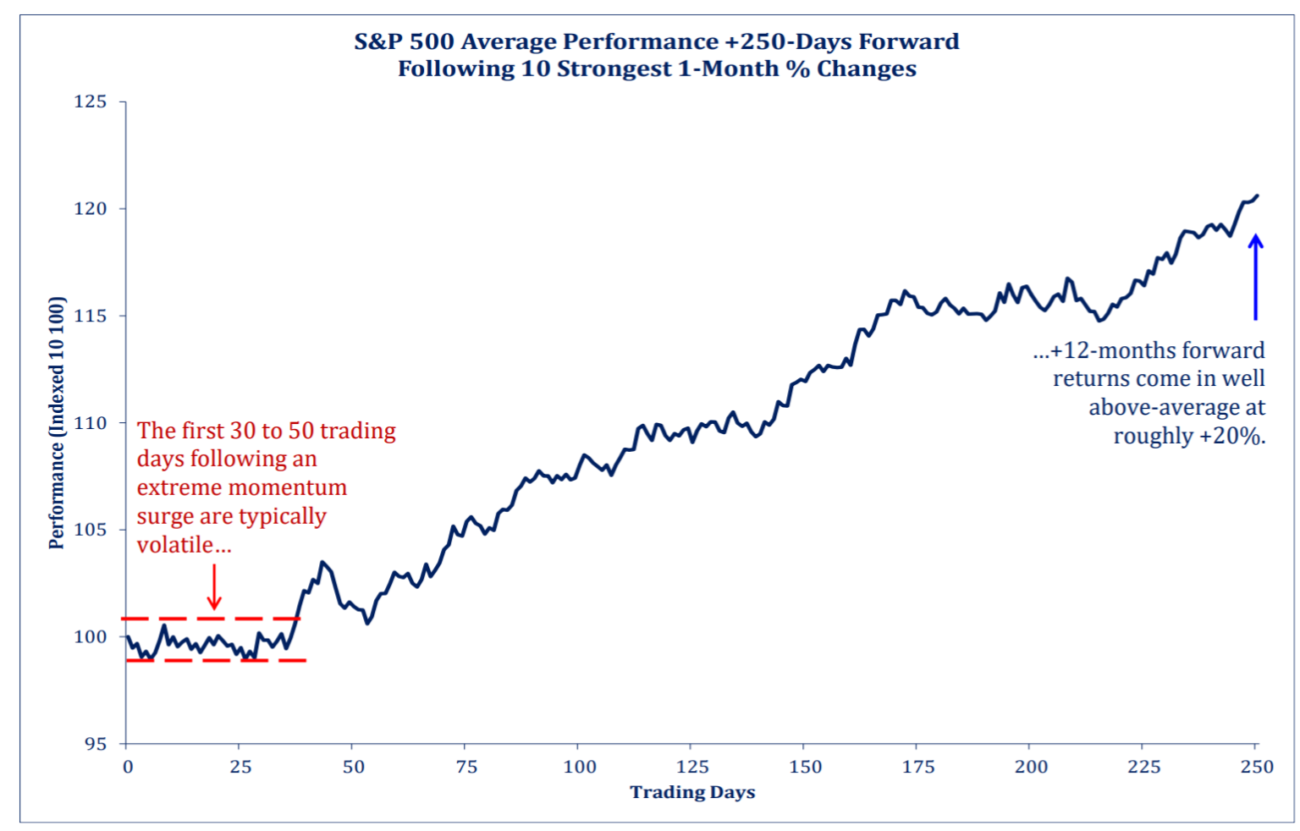
David Bahnsen, managing partner of the Bahnsen Group, reflected on the data in a Wednesday evening note. He said that this confirms the wealth management firm’s view that near-term stock market volatility will eventually give way to long-term fundamental strength.
In market technicals, expectations for short-term volatility our (sic) of a market recovery followed by longer term fundamental strength remains our view, and remains the current reality.
As Bahnsen points out, the S&P 500 has rallied in the trading year following each of its ten biggest 20-day moves. And not just by a little. The index surged an average of 20.6%, far outstripping its historical average of 8.8%.
The historical data suggest that near-term volatility will give way to a sustained upward climb in the months ahead. | Source: Strategas Research via the Bahnsen Group
The research suggests that traders who have been sitting the rally out might not have much time to get back in before the recovery accelerates. Within six months of its strongest moves, the S&P 500 had risen on eight-of-ten occasions for an average gain of 9.1%.
Bahnsen writes,
The last 20 days as a % move up represent the second best 20 days in S&P history (the first was the immediate 20 days after the March 2009 generational market bottom). In looking at the top-10 “best 20-day moves” of all time, in 10 out of 10 cases, the market was higher nine months later. 80% of the time markets were higher four months later.
Of course, as Bahnsen warns, “past performance is no indicator of the future.” And that’s the rub. The stock market has never encountered economic headwinds quite like this.
Even the best analogues – World War I and the Great Depression – occurred so long ago that it’s questionable whether you can really draw any lessons from them at all.
“Nobody in America’s ever seen anything else like this,” he told the Wall Street Journal. “This thing is different.”
Disclaimer: The opinions in this article do not represent investment or trading advice from CCN.com. Unless otherwise noted, the author has no position in any of the stocks mentioned.
Josiah is the former U.S. Editor at CCN.com, where he focused on financial markets. He lives in rural Virginia. Connect with him on LinkedIn or email him directly at josiah.wilmoth(at)www.ccn.com.