Bitcoin price pulled back over the weekend but it is still firmly in bull territory. | Source: Shutterstock
Share
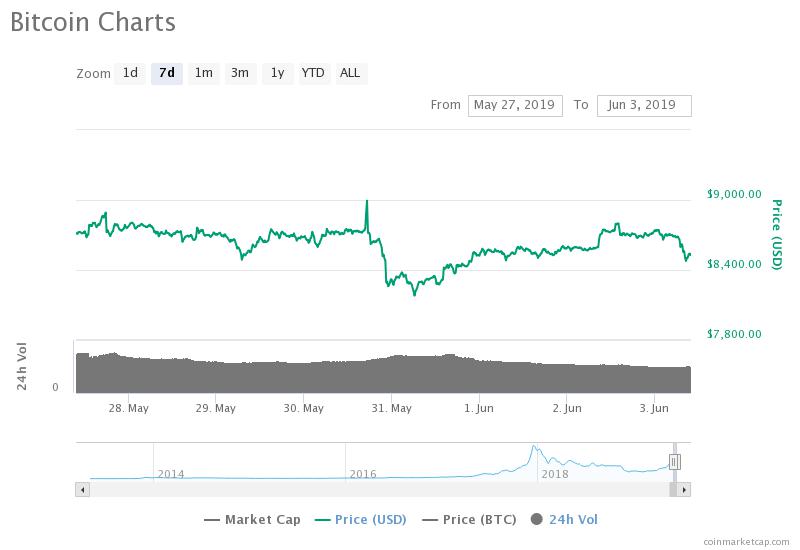
By CCN.com: In an overnight pullback, the bitcoin price has dropped by around 2.3 percent from $8,700 to $8,500, leaving major crypto assets such as Ethereum, Bitcoin Cash, XRP, and EOS with 3 to 8 percent losses against the U.S. dollar.
The bitcoin price has been on a downward trend for nearly a week (source: coinmarketcap.com)
As the bitcoin price endured a minor correction, the valuation of the crypto market has dropped by nearly $11 billion from $279 billion to $268 billion.
Still, despite the short-term correction of bitcoin and the likelihood of a pullback extending throughout the upcoming days, a key technical indicator suggests that the dominant crypto asset has entered into a bull trend.
Not all gloomy for bitcoin
In technical analysis, the Guppy Multiple Moving Average (GMMA) is an indicator used by traders that spots key changes in trends and breakouts by utilizing moving averages in different time frames.
Josh Rager, a cryptocurrency analyst, explained that the GMMA has signalled the end of the bitcoin bear market as the price of the asset surpassed $7,000 earlier this month and that the trend would still remain bullish following a strong pullback.
People have questioned if ‘dips are buying’ And my answer is still a strong ‘yes, dips are for buying’ Even if we do see strong pullback lasting weeks, the correction will only serve to refuel a strong move up post-correction with past avg. of 150% gain between 30% pullbacks.
With Bitcoin and crypto markets, anything can happen as these markets are easily manipulated But until we close below $5,500 area on a weekly level, I’ll remain bullish Let’s not forget that we just closed out the strongest monthly candle on the Bitcoin since 2017.
In recent weeks, as the bitcoin price surpassed $8,000 and achieved $9,000 at its monthly high, many traders suggested the possibility of a 30 percent pullback occurring in the crypto market based on the historical performance of bitcoin.
Since 2016, bitcoin has tended to regularly see 30 percent drops following an extended rally, which were crucial in establishing the foundation for a stable and a consistent upside price movement in the long-term.
In the past 30 days, within one month, the bitcoin price has surged by 53 percent against the U.S. dollar.
Since May 4, the bitcoin price has increased from $5,500 to $8,500 in a strong rally, seeing 10 to 15 percent drops on the way.
However, the asset has not seen a major pullback just yet, which have led technical analysts in recent weeks to be cautious about the prospect of a relatively large correction occurring.
What potential catalysts are on the horizon?
Alex Krüger, a global markets analyst, reported that bitcoin was the second most traded asset at the CME futures market on May 27, only falling behind the Dow Future contract.
Bitcoin is the second most heavily traded asset at the CME when measured by the volume / open interest ratio. In other words, bitcoin is an asset very actively traded throughout the day. pic.twitter.com/FelDERZHMb
Primarily due to the upside price movement of bitcoin in the second quarter of 2019, the interest towards the asset has led to a drastic increase in its liquidity on strictly regulated platforms and investment vehicles like the CME market and Grayscale’s GBTC.
“Bitcoin average daily volumes in USD are still rather small when compared to other assets in the table. However, note that the table includes only the most liquid CME futures contracts. Dozens of other less liquid contracts trade at the CME as well,” Krüger noted.
The clear increase in demand for bitcoin by accredited investors may supplement the overall positive sentiment around the market, considering that analysts generally believe the bear trend of the crypto market has come to an end.
Financial analyst based in Seoul, South Korea. Contributing regularly to CCN and Forbes. I have covered the stock market and bitcoin since 2013. Reach him on Twitter or LinkedIn.