


Bitcoin price is traveling under a bad sign. The possibility of strong decline from the current chart position is high but, thankfully, mitigated by established support below. Will the support hold? We cannot be sure and focus on building a short position regardless of where the bottom may be.
This analysis is provided by xbt.social with a 3 hour delay. Read the full analysis here. Not a member? Join now and receive a $29 discount using the code CCN29.
Bitcoin Price Analysis
Time of analysis: 15h41 UTC
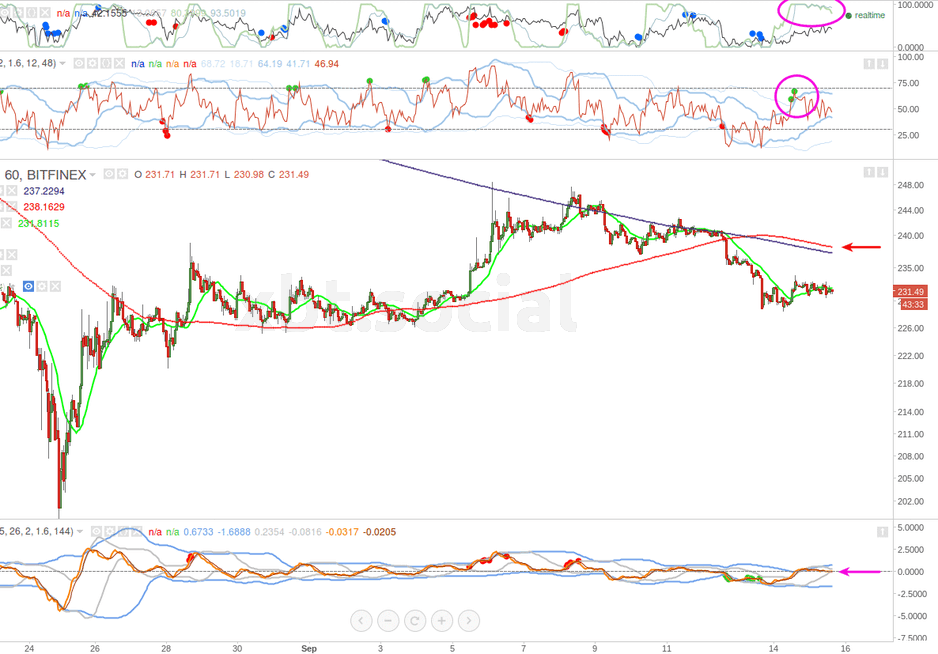
Bitfinex 1-Hour Chart
From the analysis pages of xbt.social, earlier today:
RelatedNews
Price has conformed to the expectations of our xbt.social trade recommendation thus far. Price is consolidating above $230; MACD (bottom) is training its zero line, the stochastics (top) are falling away from their upper extreme, and RSI is descending after making an upside reverse divergence to price.
xbt.social is building a short position for this trade. Traders would have opened at least one partial position when price reached the blue 50MA or when MACD reached its zero line.
It is impossible to anticipate whether the market will trade price to the 200MA or whether price will just continue lower. The best we can do is to make provision for either outcome. One way to do so is as follows: keep at least half your total position size funds available to increase your average entry level if price advances to the 200MA. Should price not make the journey higher then use the available funds to make a confident entry as price drops below yesterday’s decline low. OKCoin traders can set a trigger order just below yesterday’s low to accomplish this entry.
Either way, we want to avoid stopping out if price moves to the 200MA. As illustrated in the xbt.social Leverage 100 and and Leverage 300 resources, to keep risk constant, stop loss distance shrinks as position size increases. Observe this principle and keep your stop loss above the 200MA until price falls to a new low.
A great trader is like a great athlete . You have to have natural skills, but you have to train yourself how to use them. – Marty Shcwartz
Summary
Whether price returns to upside support near $240, or continues sideways during the coming trading sessions, the price pattern and chart indicators imply decline. The depth of decline is not certain. Strong support waits at $210 and $200. For now the priority is to build a short position at optimal junctures in the chart.
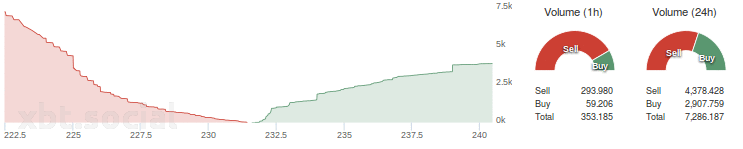
Bitfinex orderbook depth and Buy/Sell Volume:
Click here for the CCN.LA interactive bitcoin price chart.
What do readers think? Please comment below.
This analysis is provided by xbt.social with a 3 hour delay. Read the full analysis here. Not a member? Join now and receive a $29 discount using the code CCN29.
Readers can follow Bitcoin price analysis updates every day on CCN.LA. A Global Economic Outlook report is published every Monday.
Disclaimer
The writer trades Bitcoin. Trade and Investment is risky. CCN.LA accepts no liability for losses incurred as a result of anything written in this Bitcoin price analysis report.
Bitcoin price charts from TradingView.
Image from Shutterstock.


