


Bitcoin on Friday recovered more than 3 percent from its intraday low near $6,800.
The BTC/USD began the day continuing to its steady upside recovery and reached as above as 7020-fiat during the early Asian trading session. The bounce back could have been more effective had it managed to break above 7000-fiat for a more extended period. But as the European session came into play, traders visibly started exiting their positions around 7000-fiat – verifying it as a strong selling area. As a result, the pair dropped and formed lower lows towards 6883-fiat, on which it is now attempting a bounce back towards the intraday high.
BTCUSD Technical Analysis
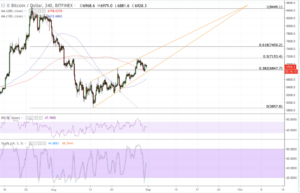
On a 4H BTCUSD chart, BTC/USD continued to trend inside the rising wedge pattern, hinting the near-term bounce and reversals as part of extended upside momentum. Nevertheless, the wedge also draws potential breakout levels for us to consider, to define our positions and stop losses likewise. There is a likelihood of pair to stay inside the channel for near-term, but a breakout towards either direction – traditionally – could mean a strong upside/downside momentum (~$700).
As the same time, BTC/USD seems to have found a decent support near its 200H moving average. The 100H MA, meanwhile, is hinting to cross above the 200H MA, which – again traditionally – could mean an extended bull run. The last time a crossover like that had happened, and the price had jumped as high as 8512-fiat.
RelatedNews
The RSI indicator on 4H charts has recovered immensely following the latest upside correction, now inside a decent buying sentiment area. The Stochastic Oscillator, at the same time, has also recovered from the oversold conditions.
Overall, the interim conditions point to a bullish bias.
BTCUSD Intraday Analysis
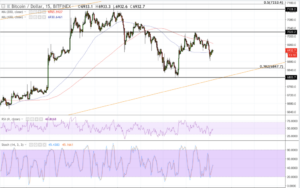
The latest fall and its responsive recovery have brought us inside a new range, defined by 7020-fiat as our interim resistance level and 6847-fiat as our interim support level. To begin with, we have entered a long position towards 7020-fiat in our hopes to retest the intraday high amidst a decent medium-term bulling sentiment. Nevertheless, placing a stop loss a marginal 3-pips below the entry point have minimized our loss should the upside reverses.
A break above interim resistance, meanwhile, will have us switch to the breakout strategy. In this case, we’ll enter a long towards 7128-fiat, our primary upside target, while keeping our stops three-pips below the entry position.
Looking the other way, we cannot rule out the possibility of a potential bearish run, first towards 6847-fiat which, if broken, could open a straight route towards 6800-fiat as a potential downside target. Though, in the context of a near-term bullish bias, it wouldn’t be wise to open a short towards a position that is just $47 away. We’re going to give it a skip until a potential bearish momentum is established, which should be the case when price breaches below 6750-fiat.
Trade safe!
Featured image from Shutterstock. Charts from TradingView.


