


The bitcoin-to-dollar exchange rate is holding above 6400-fiat as it goes towards testing major resistance hurdles to the upside.
The pair moved 1.5 percent above its intraday low near 6346-fiat on Coinbase Pro while trading at over 7 percent premium rates on Tether-featuring exchanges. The volume, however, slowed down in contrast to Monday’s wild swings, indicating that serious traders waited for things to return to normalcy. As a result, Tuesday’s bitcoin trading session on non-Tether exchanges remained comparatively calmer. BTC/USD moved marginally throughout the Asian and the European trading hours. It is believed to continue a sideways trend for the rest of the US session while sighting a breakdown/breakout session.
BTC/USD Technical Analysis
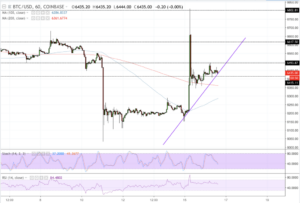
The hourly charts are signaling a neutral bias following the latest price action. BTC/USD is trading above its 100 and 200H simple moving averages, both positioned to cap declines. The RSI momentum indicator is sailing inside the buying region, awaiting a correction since the price normalcy. The Stochastic oscillator, on the other hand, has its head towards the selling region.
Traders need a decisive breakout or breakdown action from large players to come out of the current bias conflict. The downtrend is capped by 6400-fiat as of now, and also the near-term – and somewhat weak – bullish trendline.
RelatedNews
BTC/USD Intraday Analysis
Using the same chart above, we can define our intraday support at 6415-fiat while considering 6500-fiat as an already-proven psychological resistance. The decent gap between the support and the resistance gave us adequate room to apply our intrarange strategy. That said, a bounce back from support would have us open a long position towards the resistance, and a pullback from resistance would have us close our long and open a short entry towards the support. As far as there is no breakout action, the intrarange can have us make some decent profits.
Meanwhile, in the event of a breakout, in which BTC/USD breaks above the interim resistance level, then we’ll open a long position towards 6550-fiat in the event of lower volume. If the trading volume seems higher on a breakout, then the 6600-6617 fiat range could pose a potential upside target. No matter which long position we enter, our stop loss will be maintained just 4-pips below the entry level to minimize our losses in the event of a pullback.
A breakdown action, on the other hand, will put us on a wait-and-watch scenario.
Featured Image from Shutterstock. Charts from TradingView.


