


Bitcoin price meanders near its low, apparently acquainting itself with long-term support. Chart technicals to one side today, as we consider the question “Do fundamentals drive price?”
This analysis is provided by xbt.social with a 3-hour delay. Read the full analysis here. Not a member? Join now and receive a $29 discount using the code CCN29.
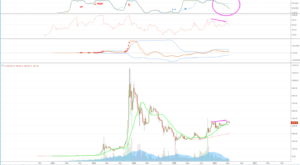
Bitcoin Price Fundamentals
Time of analysis: 14h00 UTC
Bitstamp 1-Week Candle Chart
Today’s article considers the bitcoin price chart in context of similar speculative markets. The discussion focusses on the notion of fundamentals. The term fundamentals is used in its broadest sense, and not in the strict investment definition that refers to company balance sheets, work in progress, and so on. Although there are parallels between the bitcoin price market and other commodity markets, as briefly explored below, it is not being implied that their broad fundamentals are identical – of course, there are idiosyncrasies – especially with Bitcoin. The discussion will show that there are similar investment and trading psychologies at work.
RelatedNews
Do Fundamentals Drive Price?
Many bitcoin holders are wondering how bitcoin price could possibly be declining despite strong protocol fundamentals, surging interest, and a pending supply deflation. Surely, these factors should lead investors to accumulate, or at least hold, bitcoin in anticipation of an imminent rally? Consider that the bulk of daily bitcoin exchange volume is not necessarily transacted by long-term investors, and that forces unrelated to market fundamentals can, and do, motivate a large section of market participants’ decisions.
It is a widely held belief that fundamentals drive market prices. OPEC imposes a multi-month output quota and the reasonable assumption is that, with demand for oil remaining constant, reduced supply will cause the price of oil to rise. Or the Fed implements a program of quantitative easing, as they did in 2008, and the fundamental implication drives investors, who assume money supply inflation will devalue their dollars, into gold instead.
Gold XAU/USD Long-Term Chart
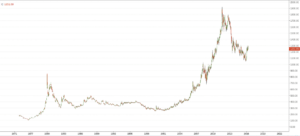
These are examples of fundamental factors exerting known pushes and pulls on markets. The assumption made in each case, is not incorrect and a causal link between fundamentals and price can be demonstrated. However, fundamentals are not the only influence on market price, nor are they necessarily the strongest influence. Notice how, during the Fed’s most active phase of US dollar inflation, from 2011 to 2014, gold was in a bear market.
Speculative Markets
Markets and trade have always been the primary domain for speculation. Some assets and market instruments, due to their inherent difficulty to trade, favor a buy-and-hold (or investment) approach. Property and gold bullion (bars), for example, do not favor quick buying and selling and are best suited to a medium- or long-term investment strategy. Yet, by contrast, almost all commodities futures instruments – and property ETFs – are specifically streamlined to be rapidly bought and sold.
The ability to rapidly trade in and out of an instrument – at leverage, along with the ability to sell the market short – attracts short-term speculators (both small and large) and results in a price chart with an exaggerated amplitude and, often, volatility. Consider the Coffee Futures market since 1972, for instance:
Coffee Futures Long-Term Chart
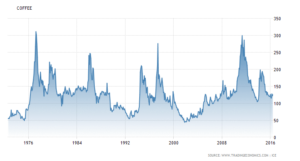
Supply and demand dynamics, no-doubt, influenced the price of coffee over the decades, but the long-term chart above is also a fractal of intraday and annual price charts for coffee. In other words, the large price swings are not primarily a result of long-term investment decisions based on the fundamentals of the coffee market. Instead, the coffee chart is strongly influenced by speculative trade that seeks to buy and sell for quick profit.
Bitcoin Protocol Fundamentals
Bitcoin, the protocol network, has some incredible fundamental characteristics at its core. Most readers are well aware of the obvious, and not-so-obvious, powers inherent in our autonomous genie. To name just a few: censorship resistance, finite money supply, cryptographically secured ownership, mathematically provable consensus, qualified and competent custodianship under an Open Source development model… the list goes on. And Bitcoin’s features are unprecedented, going well beyond descriptions such as “gold 2.0”: programmable money, contracts, trustless payments, the world’s largest super-computer – soon to be augmented by SegWit and Layer 2 payment networks that will outperform VISA on every metric.
That’s Bitcoin the protocol, the innovation.
Bitcoin Price Chart
Turning our attention to the protocol’s tokens – bitcoin – and their exchange price, we see all of the usual market forces at play.
Some market participants buy-and-hold for the long-term; some participants are novice traders learning the ropes; some are seasoned traders who favor the bitcoin price chart’s behavior as a “super-commodity”; and, some are large investments institutions that offer investors “paper bitcoin” ETFs. The largest exchanges offer retail traders (non-institutional traders) leveraged trade and bitcoin futures contracts. So the ability to speculate aggressively is incentivised.
Without any central authority working day-and-night to manipulate its price to stability, and trading freely in the open market, bitcoin price is, therefore, higly volatile and prone to peaks and troughs. All Bitcoin users have, at some point, engaged the common criticism that bitcoin price is “too volatile”. And we know that the statement is pure hokum – bitcoin price volatility is not a fundamental bug, it’s an expected open market feature.
Going Up…
Naturally, every speculator buys to eventually sell. Some do so from year to year, some from day to day and often in large amounts. Hence, the bitcoin price chart behaves like a commodity – not because the CFTC says so – but because it attracts both long-term and short-term speculators, all of them eager for profit, and we see the results of their activity in the chart.
…Going Down
Fast-paced rallies and sell-offs (profit taking) are regularly followed by protracted consolidation periods. The fundamental strengths that underpin the Bitcoin protocol give it social, political, and technological value. We expect to see the steady economic valuation of Bitcoin to continue growing in the bitcoin price chart, while acknowledging that powerful, yet, unavoidable speculative forces will keep the chart swinging between price extremes.
Afterthoughts
As acknowledged at the top of the article, fundamentals do have a long-term effect on price and value of an asset or instrument. The discussion above points out the pervasive and constant influence of speculation in liquid markets. There are many schools of thought that seek to understand – and answer – the question “What drives speculation?” This topic will be explored in the coming weeks.
Summary
Bitcoin price is sticking close to long-term support near $434 (Bitstamp). There is no guarantee that the market will hold its nerve at this chart structure, establish support, and build the next wave of advance. The actual reward halving is still two months away – a long time in market terms – and a lot of water will still be drawn from the well.
Repeated failure at advance may cause potential buyers to wait for others to do the work of buying price to above $470 resistance. This dynamic could see a base develop above $430. However, if a lack of advance leads a portion of the market to impatiently sell bitcoin in order to invest in more profitable markets, or perhaps change into the newly appreciating US dollar, the bottom can easily drop out below $430.
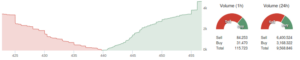
Bitfinex Depth Chart and Buy/Sell Volume
Click here for the CCN.LA interactive bitcoin-price chart.
What do readers think? Please comment below.
This analysis is provided by xbt.social with a 3-hour delay. Read the full analysis here. Not a member? Join now and receive a $29 discount using the code CCN29.
Readers can follow Bitcoin price analysis updates every day on CCN.LA. A Global Economic Outlook report is published every Monday.
Disclaimer
The writer trades Bitcoin. Trade and Investment is risky. CCN.LA accepts no liability for losses incurred as a result of anything written in this Bitcoin price analysis report.
Bitcoin price charts from TradingView.
Image from Shutterstock.


