The damage was done to the charts today. These pages have been speculating/forecasting a $316 low for the past two weeks. $316 was broken today, hitting $305 as of this writing. We continue to believe that 12/22 is the most likely date of the low. 12/22 is still four days away. A lot can happen in four days, particularly if people are panicking.
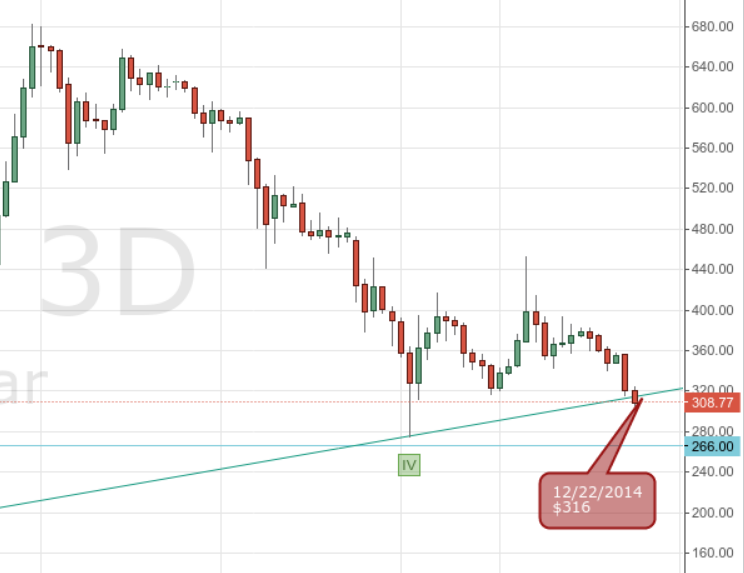
This chart is the current 3-day chart. Note that we are only one candle from the projected turn date of 12/22. But the price is now sitting below the support line. That the support line was definitively broken does not bode well on the market short term. It was unexpected and has changed my opinion of the likely market action over the next few days.
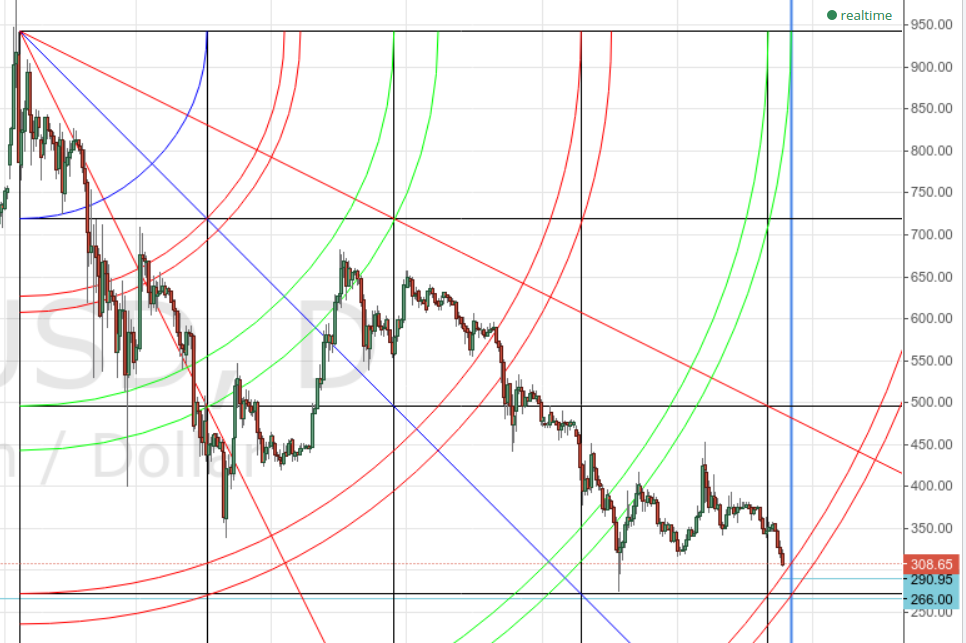
Here is our daily chart. As you can see, we are approaching the 5th arc. The 5th arc is not trivial. 5th arcs often (but not always) end market moves. The arc would be hit by today’s candle at ~ $290. We are almost there now. If $290 breaks, the next support (on the daily chart) is at the top of the square – $272. (The light blue line below that is at the $266 April 2013 high.)
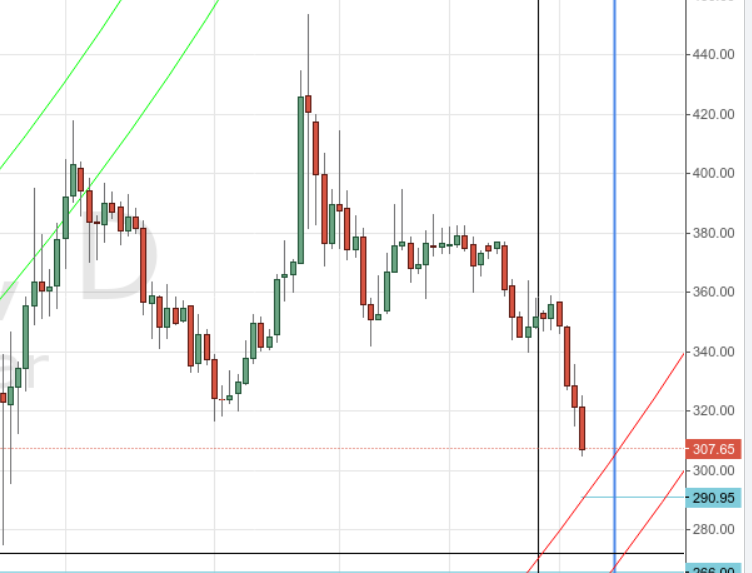
Here is a blowup of the current daily chart shown above, focusing on the present candle. Note that we are closing in on the previous low at the far left of the chart. This will likely be significant support ($275). The blue vertical line is 12/22.
Each of the above charts suggests there is reason to believe we are quite close to the end. The problem is that we are still a few days from the expected high energy date of 12/22. A lot can happen in four days, particularly if panic selling continues. If $303 breaks, we may go significantly lower than I imagined we would. A test of $266-$275 would not be unreasonable.
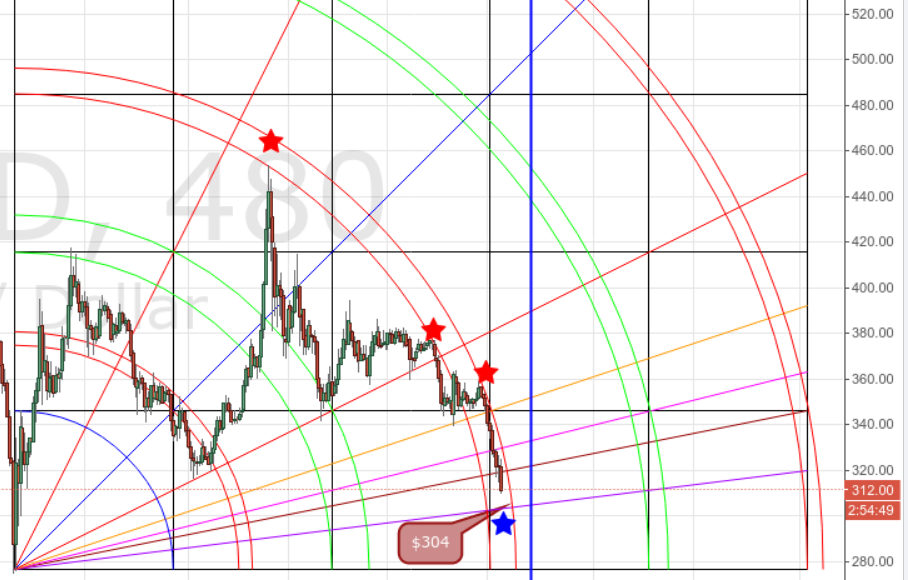
Here is a very different look at the market. It is an 8-hour chart with a bullish 3-candle setup from the October low. You will note that the 3rd arc pair has been stopping price with a vicious ferocity for months now (red stars). The arc of resistance stopped the Nov. advance and was the same resistance where we went short at $380 a few weeks back.
There are good news and bad news in this chart. The good news is that the 3rd arc pair is almost out of time. We will be through it in a couple more days at the latest. (The blue vertical line is 12/22.) The bad news is that we aren’t through it yet, and on this chart, the next support is at the Gann fan 8×1 line, at ~$304 (blue star). We are almost there at this writing.
Summary
I would advise against panic. If you are going to sell, do so with a plan that makes sense, even if you have to adjust that plan over the next few days. The market will likely test $303 next. If $303 gets taken out, we may see a test of $266-$275 as panic selling continues. STAY SHARP. This isn’t time for complacency.
The price ratio page shows there are currently more sellers than buyers.
Disclaimer: Trading is risky. Past success is not a guarantee of future profits. CCN.com assumes no liability for any losses suffered as a result of this analysis.