Bitcoin resumed its upward climb as we posted a couple days ago on these pages. It touched the 1×1 angle on the daily chart a few hours ago at $1280. See the chart below:
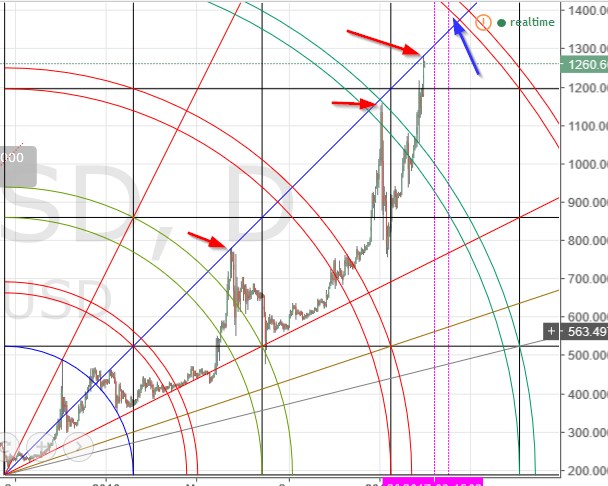
The red arrows show what has happened when pricetime hit the 1×1 in the past. History would seem to suggest that we have hit a swing high. However, I am hesitant to believe that a sharp selloff will occur here. It seems that the chart wants to touch that 5th arc overhead (blue arrow). Still, traders might consider taking a little money off the table here. If they have been long for a while they no doubt have significant trading profits to protect. However, it might be prudent to leave some money on the table, as there might be a bit more of a rise to $1300+.
Ethereum
Ethereum has been the star of the day for a while now. It has risen some 70% in the past 2 weeks. But there are huge warning signs to watch.
Looking at the daily chart below, one can see that pricetime is going to hit not one, but two 5th arcs, on two different setups, somewhere around $20.
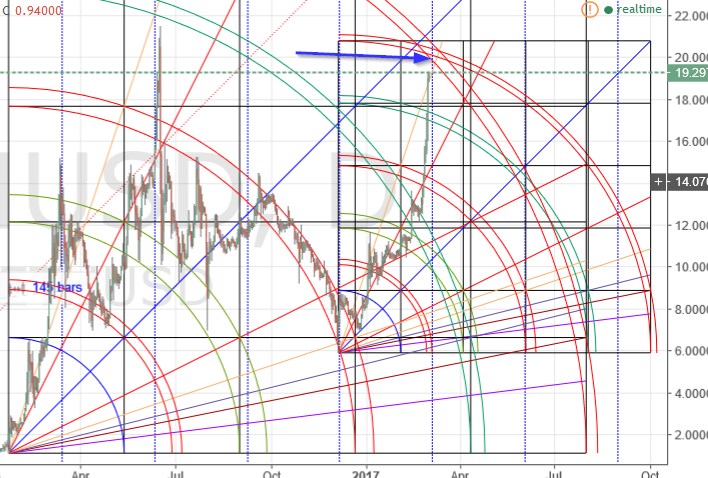
Worse still, that dotted blue line is telling us that tomorrow marks 90 degrees from the December 2016 low. My humble advice is that traders strongly consider closing long positions here, and soon. No doubt there are plenty of trading profits to protect, and only greed would argue against protecting them here.
Aggressive traders might consider opening a short around $20, with a stop loss above the 5th square of the smaller setup, at ~ $21.
Happy trading!
Remember: The author is a trader who is subject to all manner of error in judgement. Do your own research, and be prepared to take full responsibility for your own trades.
Featured image from Shutterstock.