Bitcoin Wants to Go Higher

Bitcoin dropped 150 points on Kraken, a mere 3 hours after we suggested a short on these pages a couple days ago. The question has been privately asked by several: “Is that it, or is there more of a fall coming?”
My response at the time was that I did not know; I was waiting for the market to a give a clue. Since then, it has given a modest clue, I believe. It is looking likely that the next leg will be up.
Erik Beann, the genius behind Wave59, developed a wonderful tool called the Fibonacci Vortex. It essentially calculates a Fibonacci spiral which when placed on a swing high or low can be used to visualize support and resistance as it relates to time, as well as calculate times when change is likely.
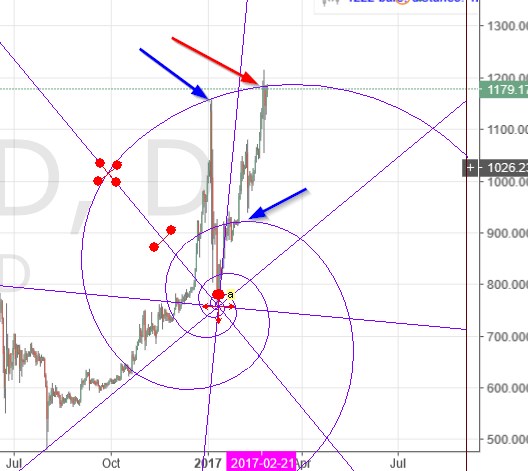
Here is a picture of the vortex on my daily chart:
As you can see, the lower of the blue arrows marks where the rally began in earnest as soon as pricetime was able to get above the 2nd spiral, which had been marking resistance for several days prior.
This is notable because the red arrow on the chart indicates that pricetime (briefly) got above the 3rd spiral a couple days ago, and is testing the spiral again as these words are typed. The fact that the spiral was penetrated a couple days ago before pulling back gives an indication that the market wants to get above it. Will it succeed in breaking through? I suspect so, though the market will be the judge in the next day or two. If so, a rapid advance will likely follow.
Not shown on that screenshot is where the next spiral is. Suffice to say, it is quite a bit higher than current prices. However, there has not yet been a buy signal offered by the tool, as price has not yet closed above the spiral. Caveat emptor.
Happy trading!
Remember: The author is a trader who is subject to all manner of error in judgement. Do your own research, and be prepared to take full responsibility for your own trades.
Image from Shutterstock.