Bitcoin is en route to break out of its bear trap. | Source: Shutterstock
Share
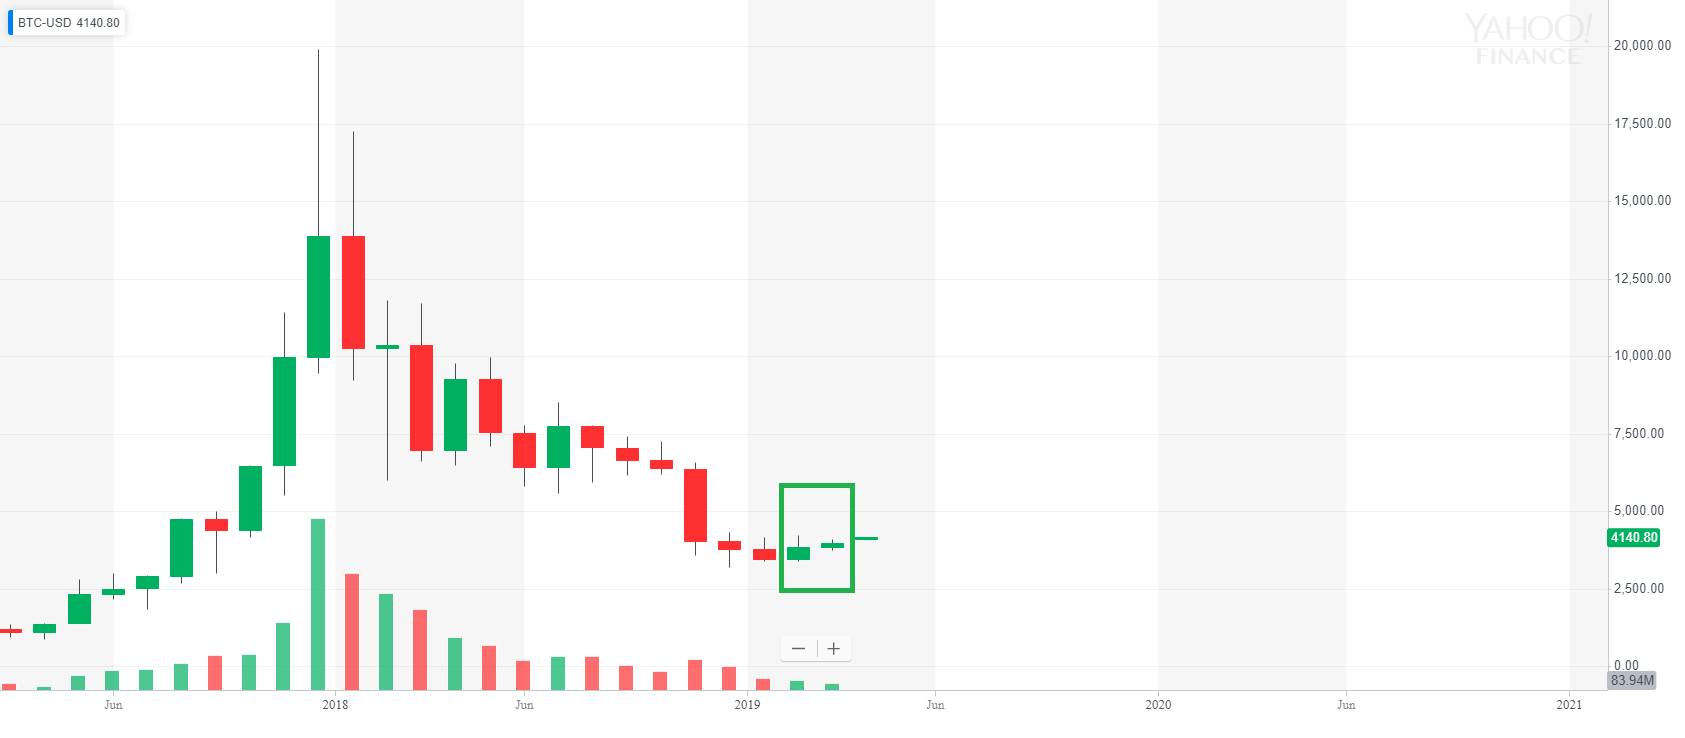
For the first time since the bull market in 2017, the bitcoin price recorded two consecutive green monthly candles, which suggest that the dominant cryptocurrency may be en route to breaking its bear trend.
In technical analysis, a green candle forms when an asset climbs higher from its opening price in a certain time frame. If a monthly candle closes as a green candle, it demonstrates a monthly upside price movement.
Consecutive Monthly Green Candles are Positive For Bitcoin
The February monthly candle of bitcoin opened at $3,434 and closed at $3,823 with an 11 percent increase in price.
The March monthly candle of bitcoin opened at $3,823 and closed yesterday at $3,942, with a slight 3 percent increase in price.
Bitcoin has not recorded two consecutive green monthly candles since December 2017, when the price of bitcoin was averaging at around $20,000.
The bitcoin price recorded two consecutive monthly candles for the first time since December 2017 (source: Yahoo Finance)
If bitcoin remains above the $4,000 level by the month’s end, which many analysts predict would happen due to the positive sentiment around the cryptocurrency market, it will record three consecutive green candles, a move that could reverse the bear trend of the asset.
“The monthly chart paints such a simple yet telling picture,” said a technical analyst regarding the monthly candle chart of bitcoin. “I think we can agree this looks like any other bearish support/resistance flip. With that said, it’ll be pretty significant if we do clear the $4,300-$4,400 level. plenty of free space above.”
Generally, technical analysts in the cryptocurrency sector are in agreeance that if bitcoin breaks out of the $4,300 resistance level, it may gradually climb to the dreaded $5,000 to $6,000 range.
Still a beautiful chart. If bitcoin can't bounce to at least 5k-6k soon, it's a really bad sign for the cyberbulls. And if it breaks down thru the yellow line at any point, even the HODLers need to GTFO. $BTC$XBTpic.twitter.com/FqqyzE1mhb
Bitcoin has struggled to test the $4,200 to $4,300 range over the past three months and every attempt at it led to a 3 to 4 percent drop in price immediately thereafter.
But, the difference between the recent bitcoin price movement and that of the last few months is that alternative cryptocurrencies are continuing to surge against both bitcoin and the U.S. dollar, indicating that investors are taking on more high-risk and high-return trades.
“Selloff getting immediately bought up sis very bullish, we’ll be testing $4,300 in no time,” a trader said after a $22 million sell wall was absorbed by bitcoin to move past $4,100.
There still remains large sell orders to be covered above the $4,100 mark, about $30 million worth, for the dominant cryptocurrency to cross the crucial $4,200 resistance level.
It may require an extended time frame for the asset to cleanly break out of $4,200 given its struggle since January. But, if the asset can cross $4,200 even by the month’s end and secure three green monthly candles in a row, it could set up the asset for a gradual recovery throughout 2019.
Is the Bear Market Over?
Throughout the past week, several analysts have said that the crypto bear market has come to an end and that bitcoin is also close to breaking out of its 16-month bear trend.
Various technical indicators show that the cryptocurrency market has regained most of its momentum in recent weeks, primarily due to the recovery of alternative cryptocurrencies and low market cap crypto assets.
“The crypto bear market has been over for three months now. BTC breaking above $4,200 will mark the end of the bear trend that started in January 2018. Going to miss this big fellow,” economist Alex Krüger said.
Regardless of the short-term price movement of bitcoin, if the market performs strongly in a longer time frame throughout the next four weeks, the asset class may demonstrate a gradual accumulation phase, which would be essential in preparing the asset class for a 2017-esque rally in the long-term.
Financial analyst based in Seoul, South Korea. Contributing regularly to CCN and Forbes. I have covered the stock market and bitcoin since 2013. Reach him on Twitter or LinkedIn.