The bitcoin price will soar to $11,500 before the clock strikes midnight to ring in 2020. | Source: Shutterstock
Share
By CCN.com: In mid-December 2017, the bitcoin price traded at around $19,000, and bullish sentiment was so strong that the $11,500 mark seemed to be a distant memory. Over a year and a half and a vicious crypto market decline later, bitcoin climbing as high as $11,500 before the end of 2019 remains unthinkable, even to many bulls.
Such is the beauty and the madness of trading. Those who possess the experience and the skill can leverage the psychology of the masses to supercharge their net worth. Bitcoin presents a unique opportunity where you can exploit the current bearish bias to your advantage. In this article, we reveal why bitcoin will soar as high as $11,500 before 2019 ends.
Bitcoin Market Has Entered Undeniably Bullish Territory
Most who lean bearish on bitcoin argue that:
The market is in a year-long downtrend/bear market
Bitcoin is overbought
While these arguments may sound plausible over short timeframes, they hold no ground over the long term. A quick look at the monthly chart eviscerates both views.
First and most importantly, bitcoin is no longer in a downtrend for two technical reasons.
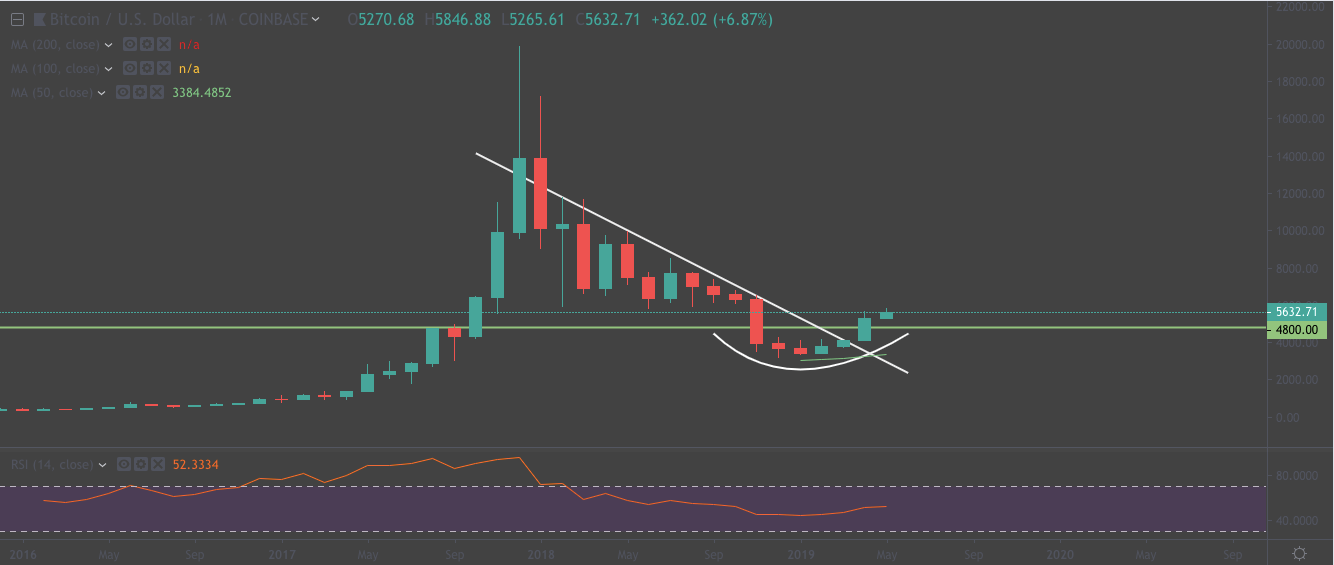
One, the market went through a five-month accumulation between December 2018 and April 2019. During this period, it painted a rounding bottom pattern on the monthly chart. Bitcoin broke out of that pattern in April 2019 after taking out resistance of $4,800 on Coinbase. In technical terms, the rounding bottom breakout is a trend reversal.
The cryptocurrency market has already achieved a trend reversal. | Source: TradingView
In addition to the rounding bottom breakout, bitcoin also pierced the diagonal resistance that has kept the market bearish for over a year. The move above the resistance helps clear the way to $11,500.
Second, bitcoin is far from overbought on the monthly chart even after the technical breakout. It actually has room to explode.
These developments tell us that bitcoin is bullish from the macro perspective. These technical indicators trump the bearish arguments of the micro perspective.
Only 1 Hurdle Stands in the Way of $10,000 Bitcoin Price
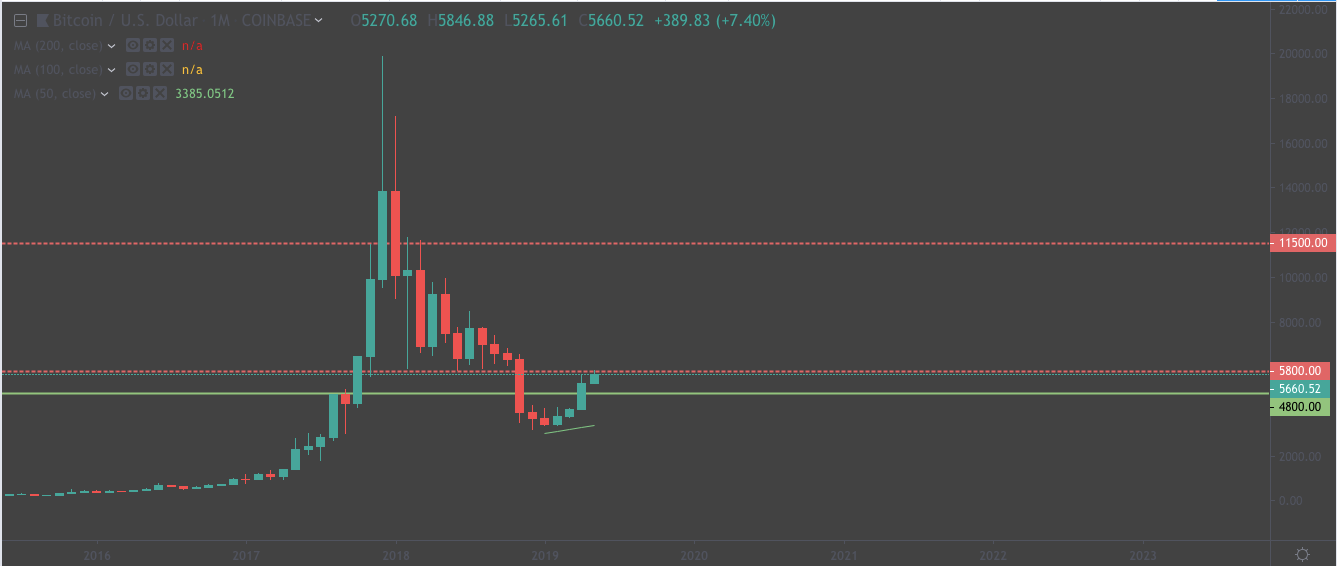
The key to skyrocketing to $11,500 before of end year is for bitcoin to flip $5,800 resistance into support. That’s because, after $5,800, the next key resistance on the longer timeframe is $11,500.
Bitcoin just needs to slay one more resistance level to ascend to $10,000 and beyond. | Source: TradingView
Over the weekend, the market touched $5,800 resistance but failed to take it out. This should come as no surprise since bulls relied on this level heavily in 2018. Bears tapped this price area multiple times before taking it out in November 2018. Thus, we can expect bears to defend it with gusto.
The $5,800 mark is a crucial resistance target for the bitcoin price. | Source: TradingView
To take out $5,800 and effectively escalate the trading range, bulls need massive fuel. They need a big catalyst that can help them push above such a heavy resistance. Enter the short squeeze.
Bitcoin Shorts Keep Rising – And That’s Bullish
Daily traders usually refer to the number of open long and short positions to predict bitcoin’s next big move. There appears to be an inverse relationship between the number of open positions and market movement. In other words, the higher the number of open positions, the more likely bitcoin moves in the opposite direction. This happens because the number of open positions provides whales and market-makers funding at the expense of retail traders.
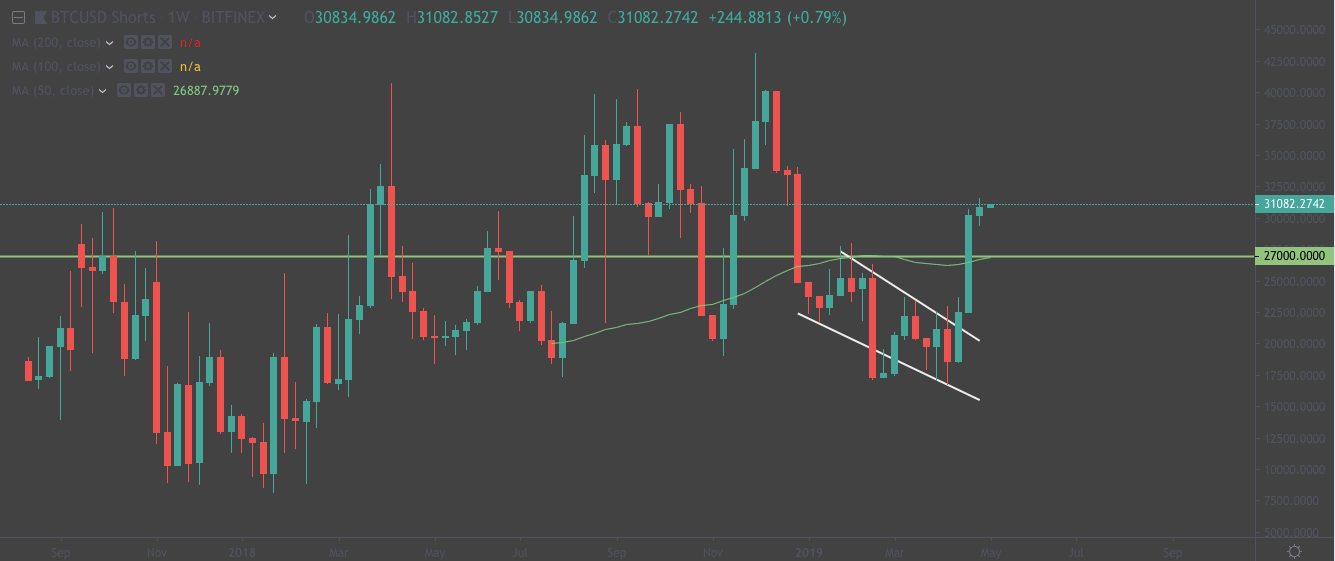
Even with bitcoin’s bullish moves, open short positions are rising. It appears to be in an unstoppable uptrend after taking out key resistance areas.
Bitcoin short positions continue to climb. | Source: TradingView
On the other hand, the BTC long positions are trending down.
BTC/USD long positions are trending down. | Source: TradingView
Looking at both charts, a massive short squeeze appears to be inevitable. This will provide the fuel needed for bitcoin to take out $5,800 and even trade above $6,000 in the next few weeks. Bitcoin’s trading range for the rest of the year will then escalate between $5,800 and $11,500 with a midpoint of $8,500.
The bitcoin price will rally to $11,500 by December 2019. | Source: TradingView
Bottom Line
Bitcoin’s trend reversal on the longer timeframe plus a massive short squeeze is a powerful combination that can drive the market to as high $11,500 before the end of 2019. This is our fearless forecast.
Kiril is a CFA Charterholder and financial professional with 6+ years of experience in financial writing, analysis, and product ownership. He has a bachelor's degree with a specialty in finance and lives in Canada.
Kiril’s current focus is on finance and cryptocurrencies.
He owns Bitcoin, Ethereum, and other cryptocurrencies. He holds investment positions in the coins but does not engage in short-term or day-trading.