It’s Been a Thrilling Day for Bitcoin Traders


Well, it turns out that today was an exciting day for day traders of Bitcoin. We have not, as of this writing, gotten a close above 750 that would demonstrate a higher high and signal a resumption of the rally of recent weeks. However, for short-term traders we did get a close on the 2-hour chart that broke through the 1×1 angle; indeed, the rally went all the way to the 8×1 angle. Here is that 2-hour chart:
 To those who caught that rally, I offer my congrats. It was surely a good trade.
Now I’m going to say something I know will upset a few bulls out there: “I would not buy here.” If there is a close just a bit higher, above 750, I would buy it there. IMHO to buy here is chasing a rally that is most likely already spent. For Elliott Wave traders, there is no discernible way (that I can see) to label this rally from the low a “5”. All I see are “3”s.
If there is a rally another 12 points higher, with a close above $750, I will miss that $12. I can live with that – $12 is not that much in the larger scheme of things. Personally, I would much rather miss out on $12 than buy what I suspect is a swing high.
Ethereum
Ethereum dropped a bit to seek support which it found at the 2nd arc. This was the second successful test of that arc. It rebounded to get back above the 1×1 Gann angle.
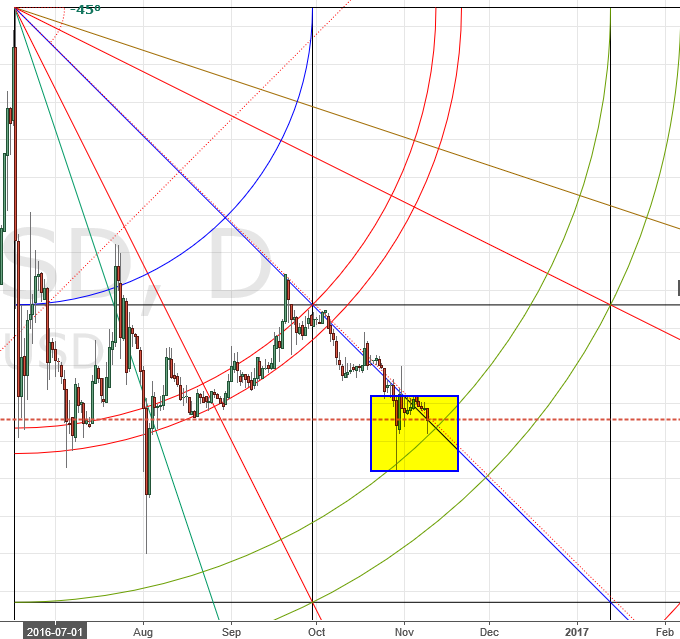 This was not quite what I was expecting, but despite the short term frenzy, no damage was done to the chart. A green candle here, should it appear, would be bullish, IMHO. On the other hand, a close below the 1×1, and/or that arc, would be bearish.
By the way, I noticed something interesting on the Bitcoin 2-hour chart. Note that the blue vertical lines are spaced 30 degrees of earth rotation apart. For the past several cycles, there has been a big spike, up or down, at that time.
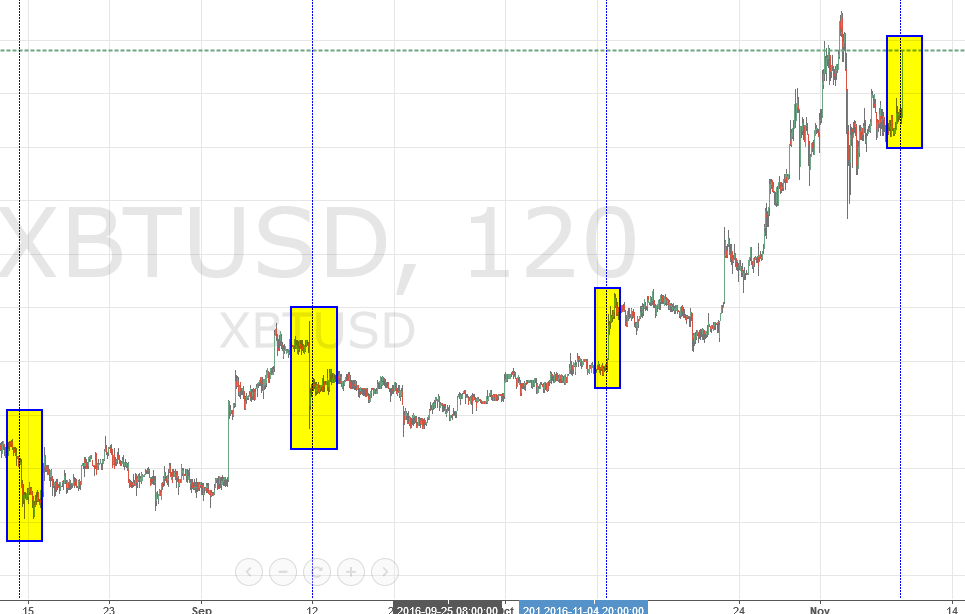 Not sure that this is “trade-able”, but it’s one of those Gann-isms that makes one say: “hhmmm….”
Happy trading!
Remember: The author is a trader who is subject to all manner of error in judgement. Do your own research, and be prepared to take full responsibility for your own trades.
Featured image from Shutterstock.
