Ethereum Drifting Lower as Bitcoin Stays Sideways

Bitcoin
Sometimes the best play is to just wait, and that seems to be the case for Bitcoin, as it continues to move sideways through an arc of resistance. As mentioned a day or two ago, this sideways movement might last close to another week.
The latest daily chart follows:

Those who have been following along will recognize that on the short-term setup, price is working its way through 4th arc resistance. The longer-term setup shows a similar picture. Interestingly, price is exactly at the point at which the 2nd of the arc pair will be hit, 90 degrees past the big jump of Sept 3.
While my hunch is that price will break free of resistance and begin the next leg up at that time, I would not suggest buying it until after we get a close above the arc. That second arc of the pair could be the kiss of death, even if it seems unlikely today. We will keep an eye on it in the days ahead.
Ethereum
Ethereum is disappointing my expectations. While it has not technically broken down yet, it is not behaving as I expected a couple days ago when I issued a buy recommendation. I have come to the conclusion that it is best to close that long position at a loss tonight. Like all traders, I don’t like taking a loss, but when the market says you are wrong it doesn’t pay to argue.
I use Tradingview for a number of reasons, They do a good job overall, but they have a few unresolved charting issues they have chosen not resolve. One of the biggest problems (imho) as a Gann trader, is that they do not offer decent scale-locking. There is a Lock Scale feature, but it is broken. They have been advised of this countless times, but have never fixed it. The result is that even when one locks the scale, the scale still changes. Often though, the change is not enough to be immediately apparent. This can be fatal, as a change in scale changes geometry considerably.
I have adjusted my daily chart’s scale, and re-plotted the bear setup I was using. It looks quite different now:
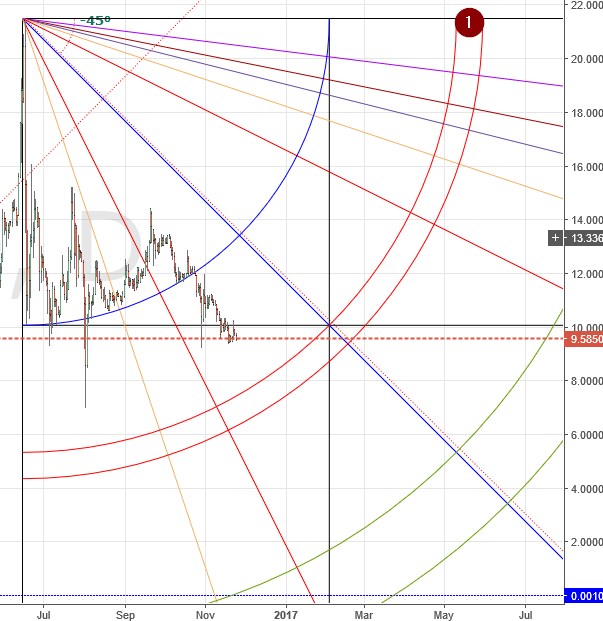 I imagine that regular readers can see why I opted to close my long position earlier in the day.
Happy trading!
Remember: The author is a trader who is subject to all manner of error in judgement. Do your own research, and be prepared to take full responsibility for your own trades.
Image from Shutterstock.
