Bitcoin Has Met a Familiar Resistance Again


Bitcoin rose dramatically in the past few days, pushing past several barriers until it got to the 4th arc on this setup on the daily chart: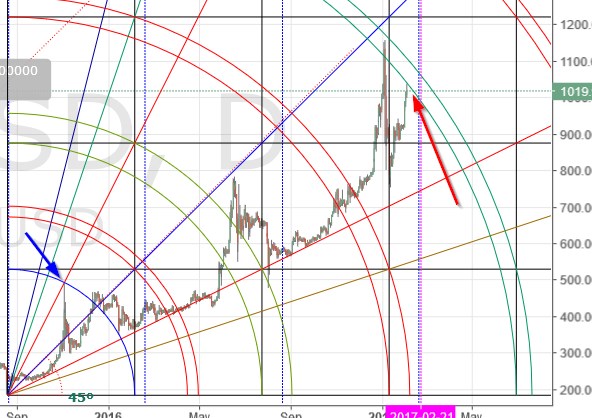
As you can see, it was this same arc pair that stopped the last major advance in early January of this year.
This setup is sized from the start of the current rally in August 2015 and the spike top 3 months later at almost $500. You really can’t make a bigger useful setup from this chart. The question that always arises is: “Will it get through the arc quickly this time?” Regretfully, there aren’t many clues on the chart. It does not bode well that the advance was stopped before it even slightly punctured that arc. Just a slight kiss on the cheek and the advance was shut down…
The 2 hour chart has a bear setup which is interesting: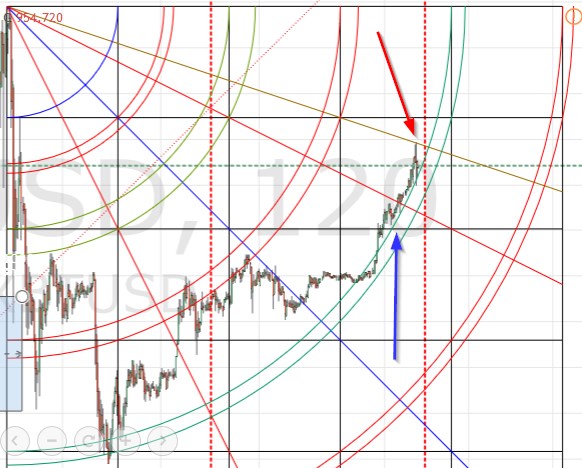
Here we can see that the recent advance has been supported by the 4th arc pair. The advance was stopped by the 3×1 Gann angle (gold line). Price very briefly tested the arc and found support, at least for now.
What is more interesting is this setup we looked at in the recent past. This bull setup on the same 2 hour chart: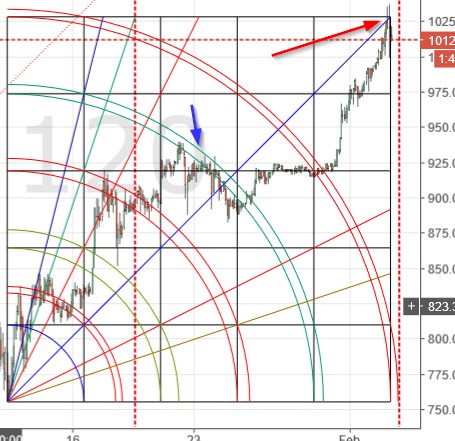
Here we see that price has (at least temporarily) reversed at the end of both the 5th square in time and in price… Astonishing, isn’t it?
I must confess that I am not certain enough in the near-term direction of this chart to open a leveraged position. However, I suspect that in the short term odds favor a correction. We will see…
Happy trading!
Remember: The author is a trader who is subject to all manner of error in judgement. Do your own research, and be prepared to take full responsibility for your own trades.
Image from Shutterstock.
