Bitcoin Has Pressed Through Resistance

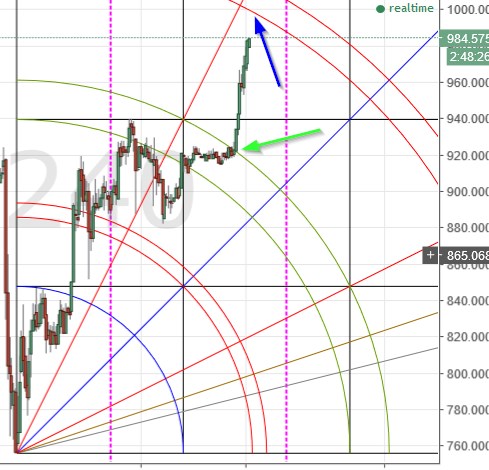
Despite having closed at the lower arc a couple days ago, Bitcoin nevertheless reversed and pushed through several layers of resistance. It is now looking at the 3rd arc on the 4-hour chart.
The market is fractal. For reasons I can only guess at, Gann setups ‘work’ on several/many levels simultaneously, even on the same chart. But only one of those setups is the ‘best’, if we define ‘best’ as the setup which forecasts correctly each turn, all the way up to the end of a move.
 The setup above is a bit bigger than the one I had been using previously. This setup, as you can see, is framed with the 1st arc (blue) touching the 2nd spike top, rather than the 1st. Using this setup, I can see that the relatively long sideways movement of a couple days ago was pricetime meandering through the 2nd arc pair. As soon as price exited the pair, at the green arrow, an explosive, if short-lived, rally began.
As of this writing, price is staring at the 3rd arc pair (blue arrow). Of course, NEVER SAY NEVER in this business. It is possible that another rally will slice through that 3rd arc pair. BUT I HIGHLY DOUBT IT.
Indeed, I have a suspicion that an excellent trading opportunity on the short side will present itself at the 3rd arc. You will note that price will hit that arc at almost exactly $1,000. A pretty round number…
Having said that, I must stress that it is exceedingly dangerous to short a bull market. I advise my students that shorting bull markets is something only very smart traders, and very dumb traders, do. So I am not giving advice to short at the 3rd arc. However, there is going to be resistance there, to be sure. I would certainly suggest closing long leveraged positions there.
Happy trading!
Remember: The author is a trader who is subject to all manner of error in judgement. Do your own research, and be prepared to take full responsibility for your own trades.