As expected in the last column, Bitcoin sold off after touching the 5th arc on the 2-hour chart, falling from $1050 top $1005. However, the fall was less than expected, and then the asset reversed and pushed its way through the arc pair. For those following along at home, the buy signal was given at $1028 on the 2 hour chart.
On the 4 hour chart, this is what recent price action has looked like when seen through the prism of an Andrew’s pitchfork: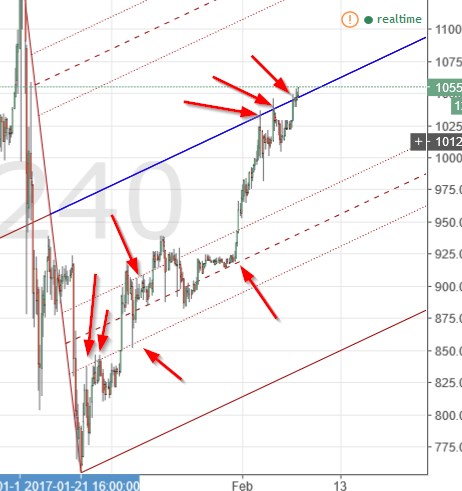 For those not familiar with the pitchfork, the bold blue line is the “0 line”. It stopped price from advancing 3 times in a row. But the 3rd and last failure was quickly overcome. We now have a close above that resistance. You can see how lesser lines of resistance from the same pitchfork provided support and resistance for an extended period of time.
Here is a Gann setup on the same 4 hour chart: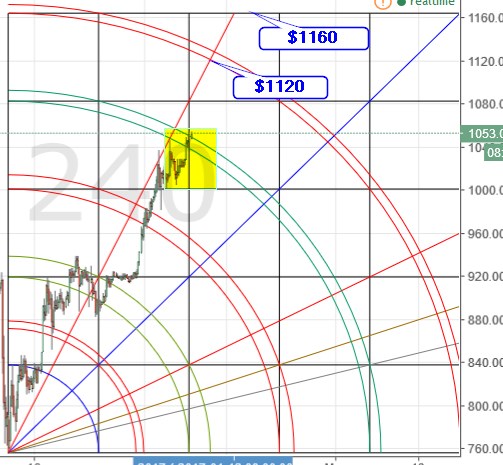 The yellow highlighted area shows how price reacted to hitting the 4th arc at $1050. As discussed above, the pullback was brief. It has since overcome the arc pair and is now looking at the top of the 4th square, the 5th arc ($1120) and the top of the 5th square ($1160) as targets.
It is worth noting that the top of the 5th square is almost at the same price as the January 2017 swing high. When/if price gets there, there will be a moment of decision. While I am on record as suggesting that we are probably witnessing a B wave of an Elliott Wave A-B-C correction to the Jan high, I am well aware that the long term trend of Bitcoin is UP. So, at that decision point, I/we will learn if I was mistaken in my thinking on this point, or not. Time will tell…
Happy trading!
Remember: The author is a trader who is subject to all manner of error in judgement. Do your own research, and be prepared to take full responsibility for your own trades.
Image from Shutterstock.