Bitcoin and Ethereum Consolidation Continues

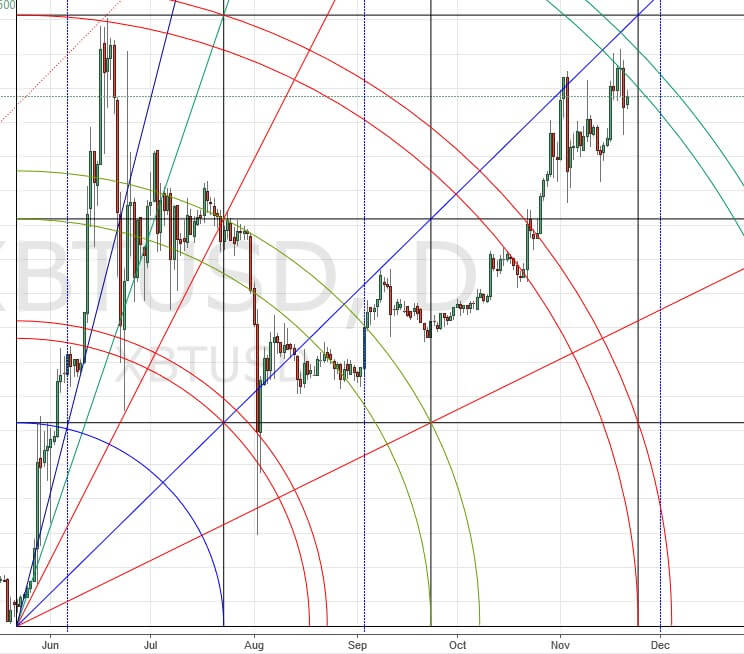
Not much has transpired in the Bitcoin space since yesterday. There was a minor selloff, but that was not completely unexpected, given that the chart is moving through an arc pair on the daily chart (3rd). I suggested yesterday that the 1.732 extension from the pitchfork would probably hold, and so far it has. Here is the daily chart with the long term setup displayed:
 While I’m sure most Bitcoin traders would rather there were no consolidations ever, they are a fact of life. As I have repeated many times, when pricetime exits the arc pair on the sunny side, we will get a buy signal.
Here is the same chart with a shorter-term setup:
 On this chart, which we saw yesterday, price is trying to get through the 4th arc pair. So far, it has been unable to get a close within the pair, but I suspect it will, in the near future.
We also looked at a pitchfork yesterday, and noted how pricetime was being contained within the 1.414, 1.618 and 1.732 extensions. Lets look at that 8-hour chart again:
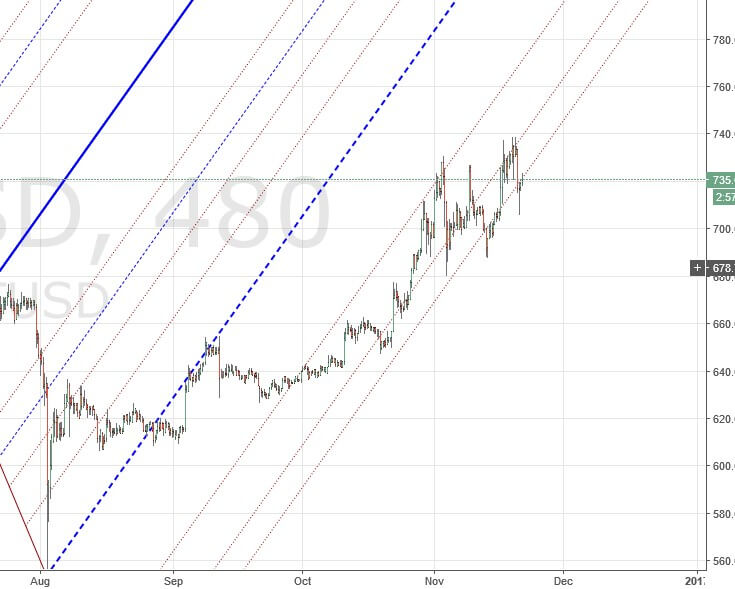 As I type these words, the 1.732 support is holding. Is there another selloff coming? I wouldn’t rule it out, because as long as pricetime is within the arc pair anything can happen. One arc is support and the other is resistance.
Ethereum
Ethereum is also treading water today, STILL unable to break free of the 3rd arc pair on a long-term daily chart. Let’s take a close-up of that chart:
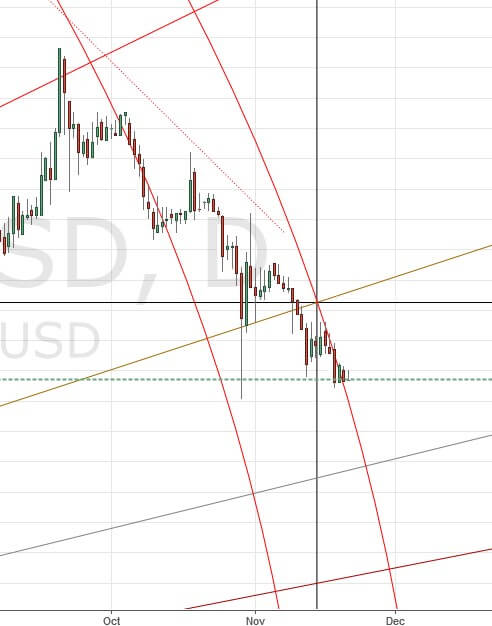
This arc pair has been tenacious in it’s grip, but it looks like it might be losing it’s grip, as today’s candle is outside the arc pair at the moment. It’s too soon to declare victory however, as the market could still close down sharply in the next 10 hours, bringing price back within the arc’s confines again. But in any case, this selling season is coming to a close soon, I believe.
Happy trading!
Remember: The author is a trader who is subject to all manner of error in judgement. Do your own research, and be prepared to take full responsibility for your own trades.
Featured image from Shutterstock.
