This One Chart Exposes Bitcoin’s Nakedly Bullish Potential


Bitcoin's ironclad bull case can be made with just a single chart. Hint: it has to do with both gold and investor psychology. | Source: Shutterstock
Cryptocurrency investors have long harped on the myriad similarities between bitcoin and gold.
At a basic level, the two assets are considered as vehicles for the storage of value. Additionally, both are interchangeable and divisible. Most importantly, bitcoin and gold have limited supply; a property that makes both assets attractive to investors and speculators.
Recently, a popular cryptocurrency trader revealed a far more striking similarity between the two assets, a similarity that derives purely from human psychology and bodes insanely well for the current bitcoin price boom.
This Gold Price Chart Is Ridiculously Bullish for Bitcoin
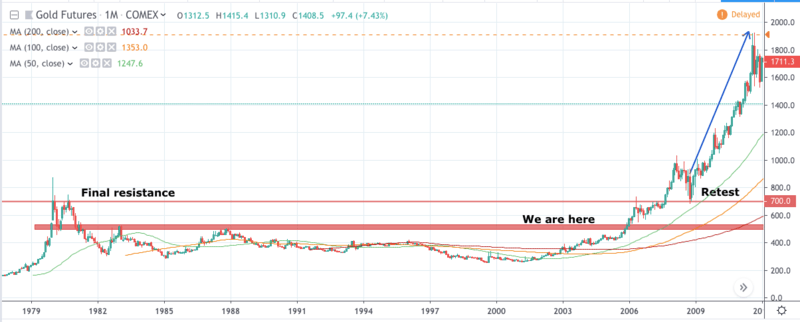
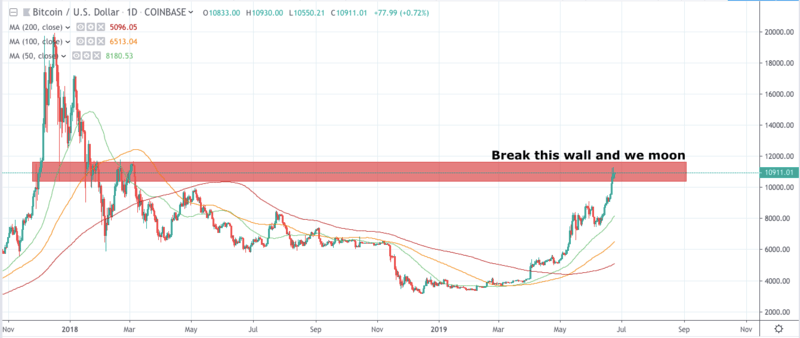
King Cobie posted an image in a tweet that illustrates the massive resemblances between the price charts of gold and bitcoin.
The similarity is so obvious that the pseudonymous analyst – whose account has accrued more than 160,000 followers since its creation during the 2013 bubble – only needed to write “Sir” as the caption.
From the perspective of a technical analyst, the similarity is undeniable:
https://twitter.com/CryptoCobain/status/1142386183038787584
One key difference between the two charts is the timeframe. The trader tweeted gold’s monthly chart while it was the daily chart for the leading cryptocurrency.
There’s a simple reason for this, as another user noted: The process appears to be expedited for bitcoin due to technological advancements.
https://twitter.com/CanteringClark/status/1142678443324256257
The Crucial Question: Where Is Bitcoin Right Now?
We are putting stock in the resemblance between the two charts because human behavior tends to be predictable.
One of the tenets of technical analysis is that history repeats itself. Thus, if you see similar patterns from two different assets, it is highly likely that these assets will have the same end result.
This begs the question: Where is bitcoin right now compared to gold’s market cycle?
To answer that question, we have to look at gold’s two key resistance levels before it became massively parabolic. The first one was around $500 and the second one was the previous all-time high around $700.
If we compare the $500 resistance of gold to that of bitcoin’s, we see the wall between $10,400 – $11,600 as the last major resistance that prevents the cryptocurrency from reaching its all-time high.
Should the king of cryptocurrencies take out that price area, there’s very little that can stop it from climbing to as high as $20,000.
Following gold’s price action, once bitcoin is above $20,000, we can expect a significant retracement to retest and convert the previous resistance into support.
Once the process of cementing $20,000 as a new support is complete, it’s clear skies for the leading cryptocurrency, technically speaking anyway. There’s no telling how high it can go since there’s no more resistance above $20,000.
The asset’s most rabid proponents are predicting that the cryptocurrency can rise as high as $1 million. At that point, bitcoin will have a $20 trillion market cap, which is almost three times the current market cap of gold at $7.5 trillion .
