The S&P 500 Needs 5 Components For Sustainable Rally—But 2 Are Missing


The S&P 500 Index has set multiple record highs this month, but a few key ingredients for a sustainable rally are missing. | Image: TIMOTHY A. CLARY / AFP
- Economist David Rosenberg said in a recent interview that the S&P 500 rally lacks fundamentals and valuations.
- Fed-induced liquidity and risk-taking investors are fueling the ongoing rally.
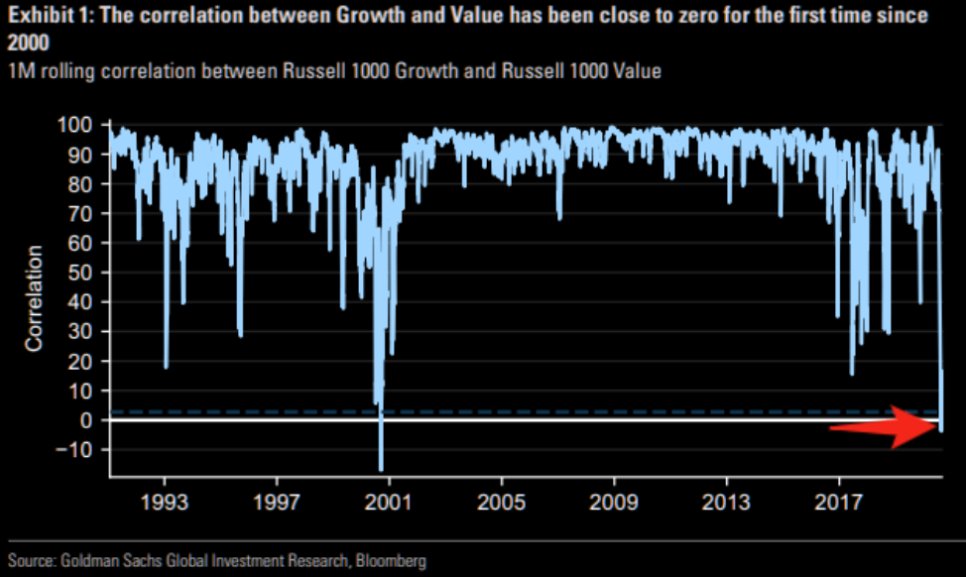
- A key metric has hit near zero for the first time since the dot-com bubble in early 2000.
The S&P 500 Index has soared 56.8% since the March 23 bottom. Now, economists are becoming cautious as fundamentals struggle to support the ongoing rally.

Speaking on Palisade Radio, Rosenberg Research founder David Rosenberg said there are insufficient fundamentals to sustain the uptrend.
S&P 500 Needs Five Components to See Sustainable Rally; It Lacks Two
Rosenberg says the S&P 500 essentially needs five main components to rally sustainably over a prolonged period.
The five components are fundamentals, valuations, technicals, momentum, and liquidity.
The S&P 500 has strong momentum, buoyed by the unexpected inflow of massive capital from retail investors . It has favorable technicals, as it recently smashed record highs.
Liquidity is continuing to surge as central banks in the U.S. and Europe push to ease financial conditions.
But the S&P 500 lacks fundamentals and valuations , Rosenberg says. The economist explained a bull market is “premised on fundamentals and valuations.” For now, Rosenberg emphasized that the market does not have the two crucial components.
Rosenberg acknowledged that technicals and momentum are primarily fueling the stock market. He noted that a “liquidity-driven bull market” is ongoing, created by the Fed and risk-taking investors.
One key metric that shows imbalance and unsustainability in the stock market is the dominance of Big Tech.
The economist found that value stocks typically account for around 45% of the market. During the dot-com bubble, it dropped to as low as 30%.
Currently, value stocks account for less than 20% of the S&P 500. That’s significantly lower than the early 2000s, leading Rosenberg to characterize it as an “egregious extreme.” He said:
I don’t know what causes the mean reversion trade or when it will come, but it will come as it did in 2000, 2001 and 2002. As Herb Stein famously said, anything that can’t last forever, won’t.
Major tech firms like Apple and Amazon have seen their stocks surge off positive earnings and Wall Street projections. The surge may continue in the short run if the pandemic lasts longer, leading more people to rely even more on technology.
Over the longer term, economists believe the ongoing trend is technically difficult to sustain. When the initial pullback happens, technical analysts hinted that it could cause a deep correction.
One Glaring Similarity Between Current Rally And Dot-Com Bubble
Fundamental analyst Ben Woodward pinpointed one striking similarity between the dot-com bubble and the recent S&P 500 trend.
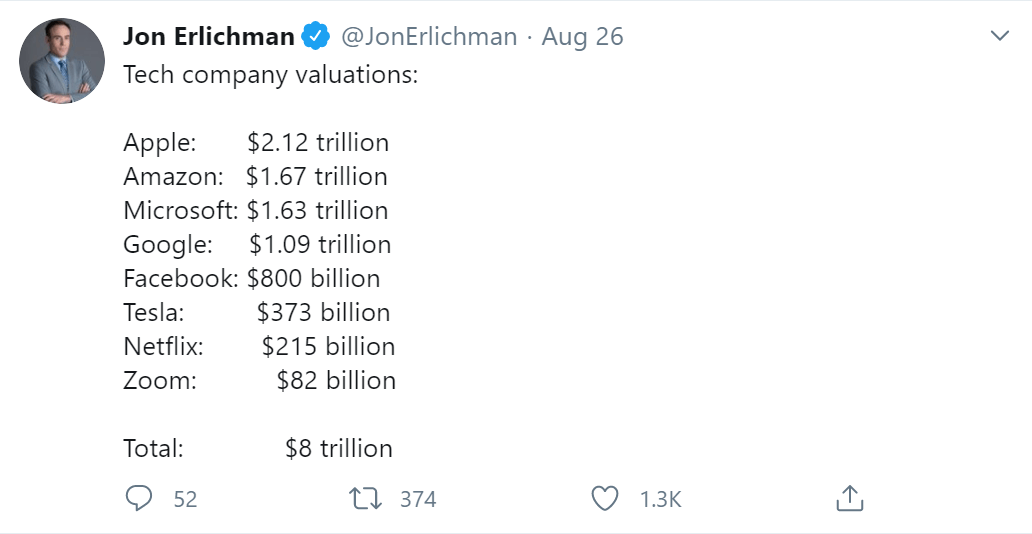
In the early 2000s, the analyst noted that four major companies dominated the market . Similarly, Big Tech, which includes companies like Apple, Microsoft, Amazon, and Alphabet, dominate the S&P 500 today:
Most portfolio managers today weren’t around in 2000 when the dot-com bubble popped. There are growing similarities between then and now, such as the chart below. The ‘Four Horsemen’ of tech stocks fueled that era like the FAANG stocks this era.
One could argue that there is a significant difference in the tech landscape of today versus 20 years ago. Tech firms are largely profitable and are seeing their profit margins grow as the pandemic lasts longer.
Nonetheless, the data show that the U.S. stock market has not seen such an extreme trend for over 20 years.
Disclaimer: The opinions expressed in this article do not necessarily reflect the views of CCN.com and should not be considered investment or trading advice from CCN.com.
