Overvalued Bitcoin Price Won’t Score $40,000 in 2019: Chart Indicator


Bitcoin's fair value at the final turn of 2019? $21,000, according to this crypto analyst. | Source: Photo by André François McKenzie on Unsplash
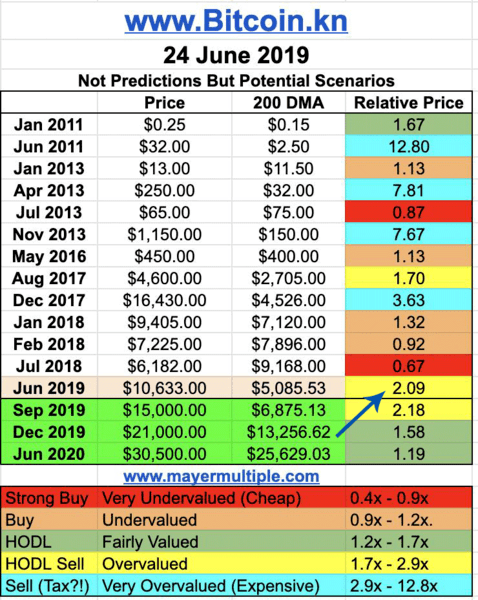
Popular cryptocurrency figure Trace Mayer believes that Bitcoin’s recent price gains may have peaked, at least in the medium term. Using his self-created Mayer Multiple, the Bitcoin maximalist this morning tweeted that there was very little chance of Bitcoin hitting $40k in the next couple of months.

The Mayer Multiple retrospectively tracks the boom and bust cycles of Bitcoin to give some indication of fair value. Consider it the speed at which Bitcoin’s price moves away from its 200 day moving average (DMA). When price moves too far too fast, the likelihood of a correction is just around the corner.
Slow and Steady Wins the Bitcoin Price Race
Bitcoin’s insane momentum has driven the price up 200% in six short months. The following chart shows Bitcoin’s wide deviation from its 200 DMA since April:
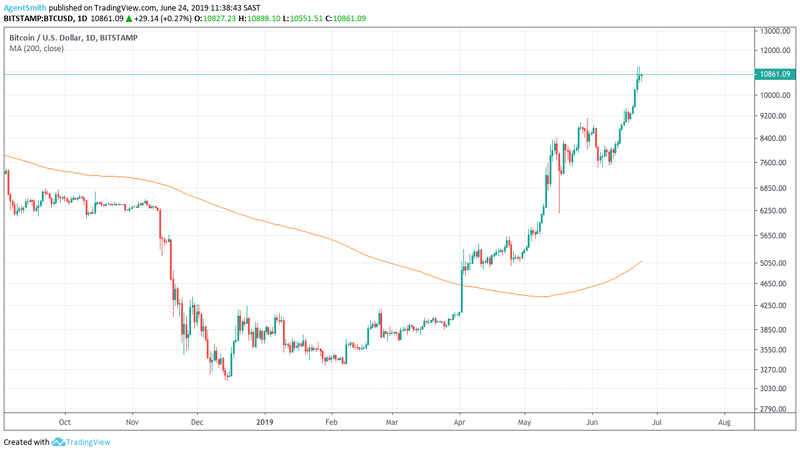
According to Mayer’s research, a good long-term strategy is to accumulate Bitcoin below a multiple of 2.4 although officially it does not actually provide buy, sell or hold signals. The Mayer Multiple currently sits around 2.10 and the average for the entire history of Bitcoin is 1.47.
The indicator’s volatility has drastically reduced since 2011 suggesting that Bitcoin’s volatility too is steadily decreasing. This should be a good sign for institutional investors and the talking heads who constantly complain about crypto’s wild price fluctuations.
Traders may get another chance to buy the dip as price returns closer to its 200 DMA thus bringing the indicator back down to more reasonable levels. That’s the theory anyway. As Bitcoin moves ever closer to a $200 billion market cap it’s anyone’s guess what happens next.
Sell At Your Own Peril
Medium and short-term traders find themselves in a bit of a predicament. Bitcoin conveniently ignores the Mayer Multiple during periods of parabolic price gains. In other words, if you used the indicator to short in 2013 or 2017 you most probably got rekt.
The indicator makes the most sense for long-term investors looking to stack Satoshis at optimum levels. Mayer’s tweet also outlines some potential quarterly price scenarios until June 2020. Bitcoin appears to be slightly in the medium term compared with previous price runs.
Ultimately it depends whether we’re in the middle of another parabolic price run or not. Prices moved largely sideways in 2015 and it may be time for another bout of consolidation.
Altcoins have mostly faded into the background as Bitcoin steals the spotlight this year. In 2017 traders loaded up on Bitcoin or Ethereum first before moving into other highly speculative assets. We’ve only really had one major Altcoin cycle to speak of. Could this be the start of the next?
Some followers think not. A response to Mayer’s tweet is already trumpeting $100k by year-end. Maximalist or not, the Mayer Multiple is probably a useful tool to have in your trading toolbox.
This is not trading advice. Click here for a Bitcoin price chart.
