Might Ethereum Out-Perform Bitcoin in the Coming Days?

Since our last Bitcoin update, price has risen a bit; enough to get me wondering whether or not it’s time to re-assess my earlier suspicion that another down movement was due. In fact, I have seen evidence to suggest that the recent panic selling might have been the low I was expecting.
To better get a feel for this question, I looked at the ethxbt chart for any clues it might offer:
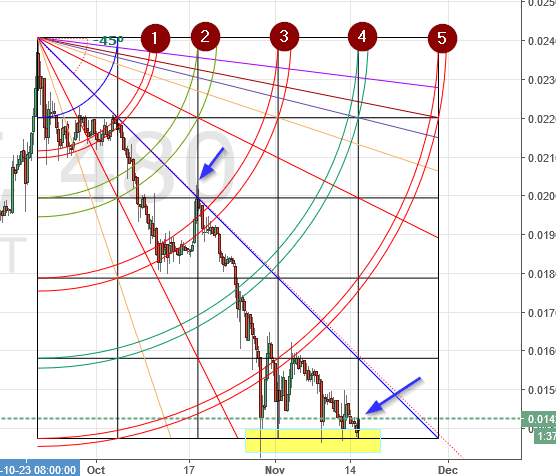 Here you can see that the bottom of the 5th square has stopped 5 declines in the past few weeks.
Note that the swing high at .020 (blue arrow) was at the end of the 2nd square in time. This is common behavior, which is not to say ‘mandatory’ behavior.
However the most recent candle has seen a noticeable rise, and the chart is now at the end of the 4th square in time. It is reasonable to suspect that a swing low might be in, for now.
What does this imply? It implies that there is a high probability that for a short while at least, Ethereum will out-perform Bitcoin. This is still unconfirmed, but there is an argument to be made for the case, based on what we are seeing here.
With this in mind, lets look at the 8-hour Bitcoin chart:
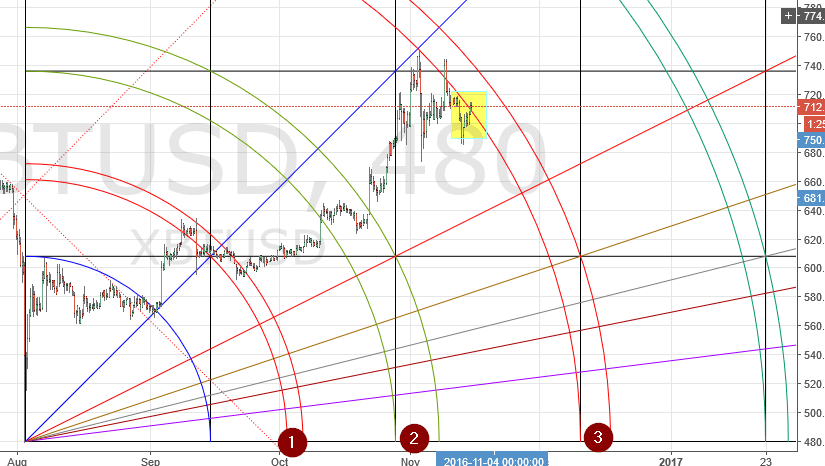 Price has closed above the 1st of the arc pair, though not by much. This is bullish long-term, but not necessarily short-term. The first of the arc pair has been violated, but as I’ve said here before: “anything can happen when price is within an arc pair”. We need a close on the sunny side of the 2nd of the pair before we break out the champagne.
I know some readers want me to give a buy signal, but I still can’t do that. However, I can honestly say I’m darn glad I didn’t violate my rule of never shorting a bull market!
Happy trading!
Remember: The author is a trader who is subject to all manner of error in judgement. Do your own research, and be prepared to take full responsibility for your own trades.
