Here’s Why Ripple’s (XRP) 14% Coinbase Pump Rally Could Fizzle Soon


Ripple (XRP) could be headed downward soon. | Source: Shutterstock
Ripple (XRP) broke out of the wider cryptocurrency bearish bias on Monday, rising as much as 14% after Coinbase Pro’s announcement.
The San Francisco-based crypto exchange had stated that it would add XRP to its basket of tradeable assets to diversify its offerings. The news led to an improvized buying sentiment in the XRP market, given Coinbase Pro’s regulated status in the US, supported European Union member nations, Canada, Singapore, and Australia. As a result, traders purchased up to $1.3 billion worth of XRP tokens, leading to an increase in its market capitalization. The move further adjusted XRP-to-Dollar exchange rate from Monday’s low near $0.304 to as high as $0.348.
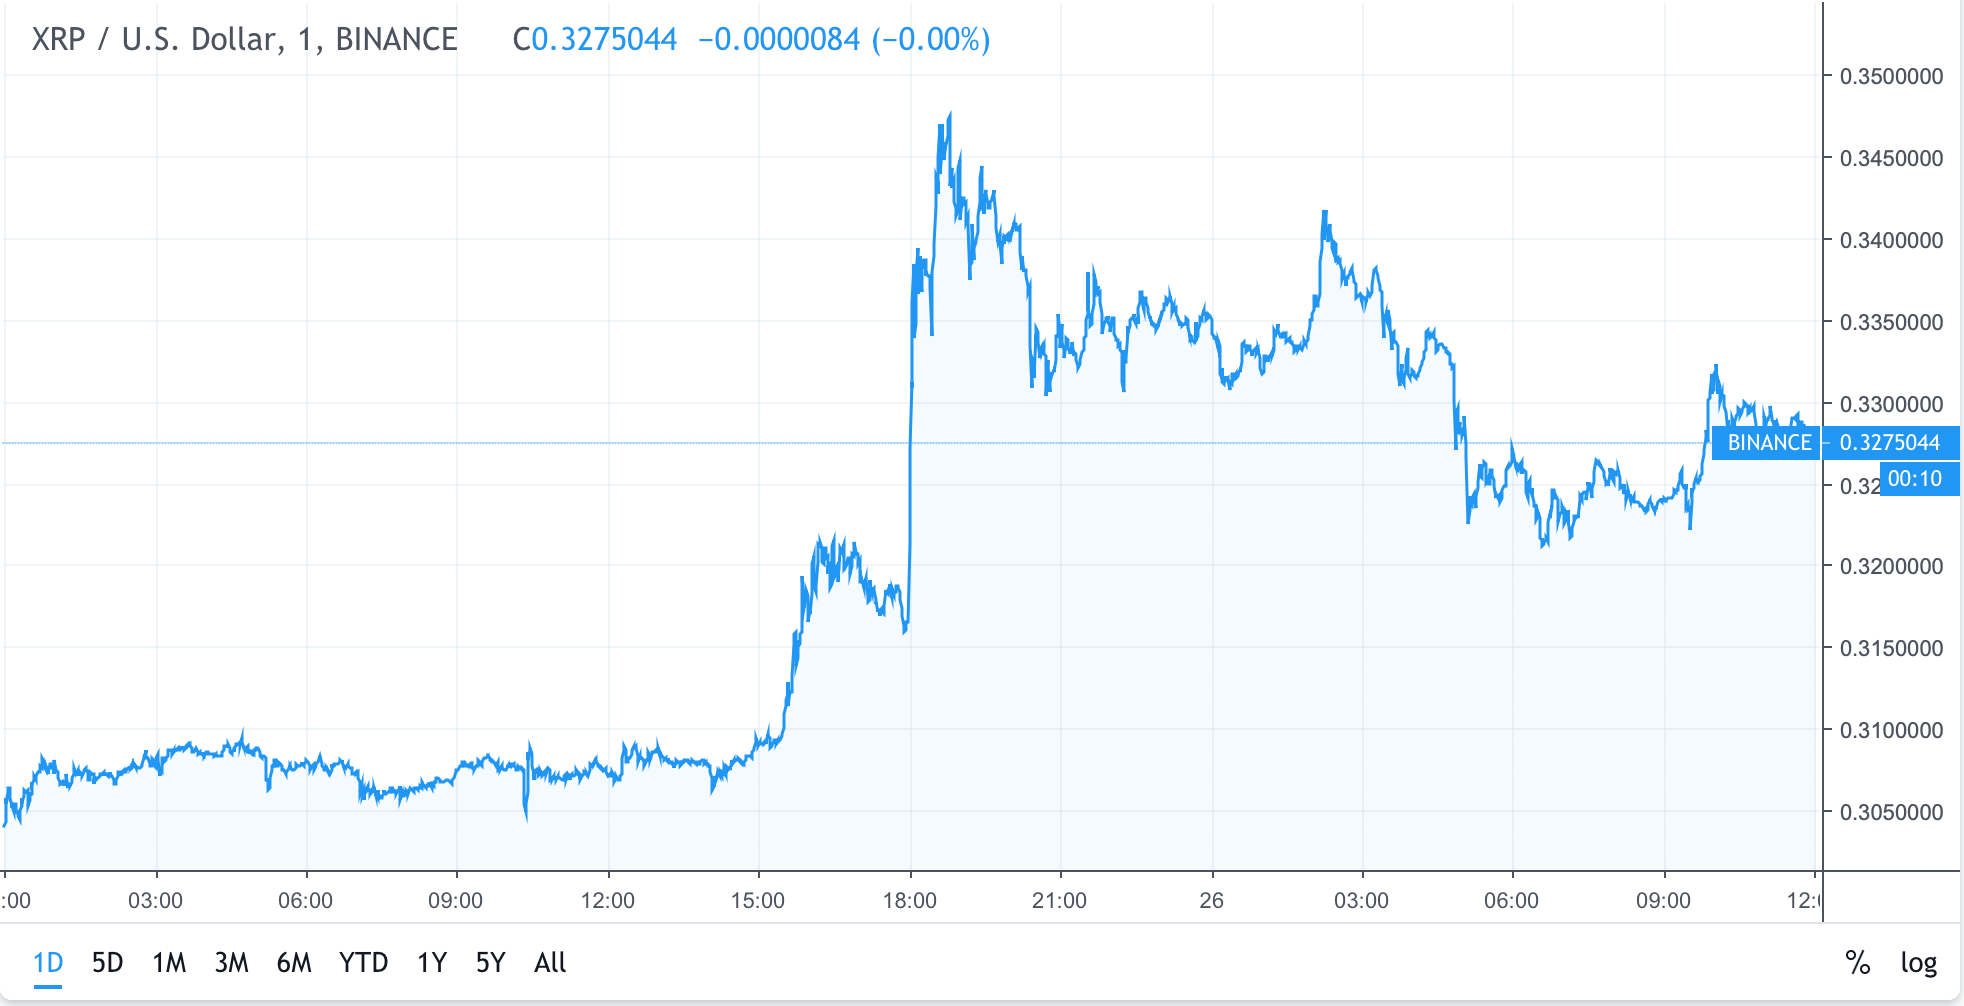
On the flip side, XRP failed to maintain its Coinbase-led pump. Influential traders started exiting their long positions near the intraday high formation at $0.348, leading to an approximately 5.74% loss on first correction wave. The downtrend didn’t stop just there. After a small consolidation session, XRP dropped another 6.68%, validating that the market was inside a broader bearish correction. Let’s have a look at the chart below for better illustration.
Bear Flag Confirmed (XRP 15-Minute Chart)
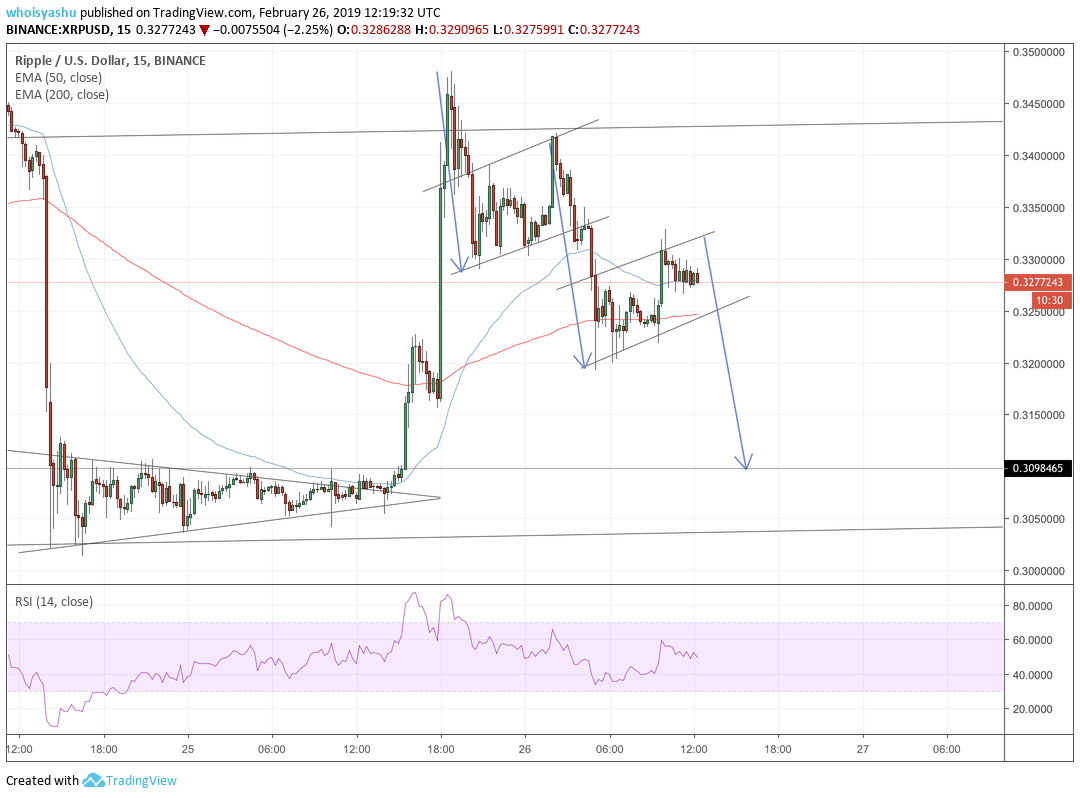
The consolidation action after the first drop led to the formation of a then-unconfirmed bear flag. The flag’s upper trendline rejected upside attempts on three separate occasions, indicating traders’ short sentiments. The bulls eventually gave up and XRP extended its downside correction towards $0.319. At the time of this writing, XRP is once again forming a bear flag, hinting that another panic drop is on the way.
A downward wave is imminent once XRP breaks below the lower trendline. Should it happen, the move would trigger a panic sell action, prompting traders to open new short-sell signals under $0.324. At the same time, XRP breaking below its 50-period EMA (indicated via blue curve) and 200-period EMA (reported via red curve) would also strengthen the bearish bias in the XRP market.
Bullish Scenario (XRP Daily Chart)
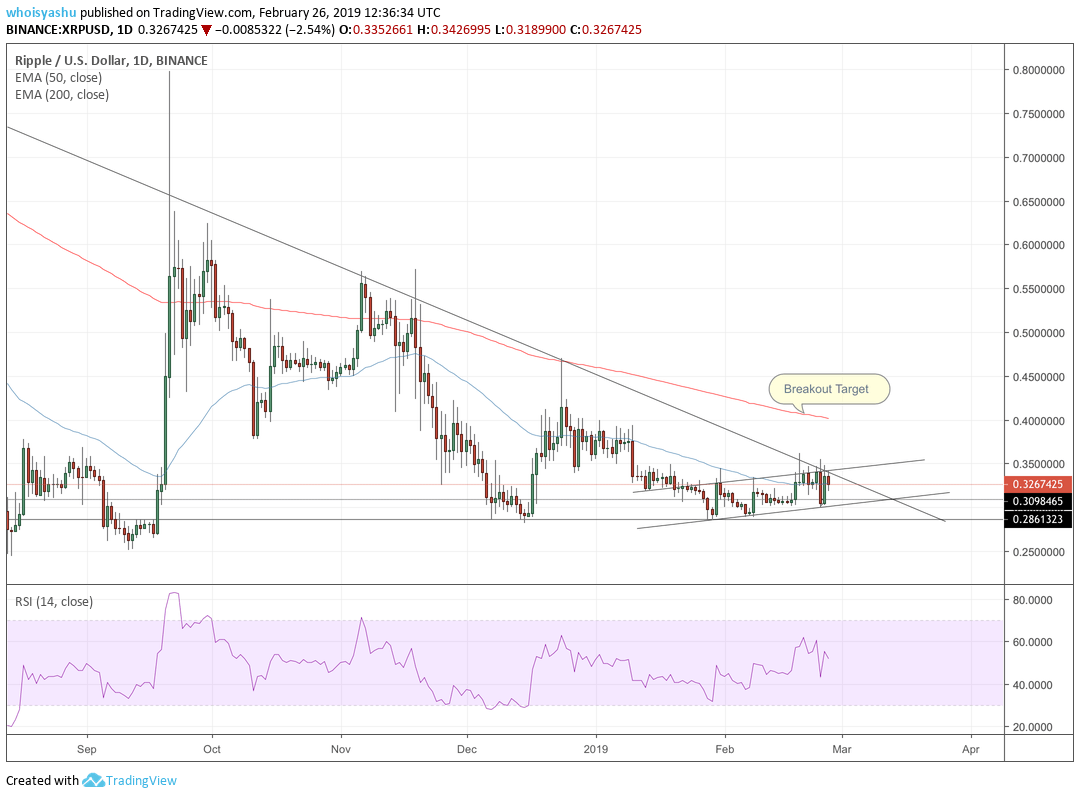
In a broader scenario, the latest upside move has brought XRP close to its long-term descending trendline. So far, the trendline has capped every XRP’s upside attempt. At the same time, the digital asset has jumped above its 50-period EMA which indicates its first shift from bearish to bullish. If XRP manages to stay above the said daily EMA, then there is a possibility that it would cross above the giant descending trendline formation.
The 200-period EMA (depicted in the red curve) poses as an ideal breakout target. If XRP manages to strike through it, then the market could confirm a real return-of-the-bulls. Until then, XRP remains inside a robust bearish bias despite its one-day wonders.
Click here for a real-time Ripple (XRP) price chart.
Featured Image from Shutterstock. Price Charts from TradingView .
