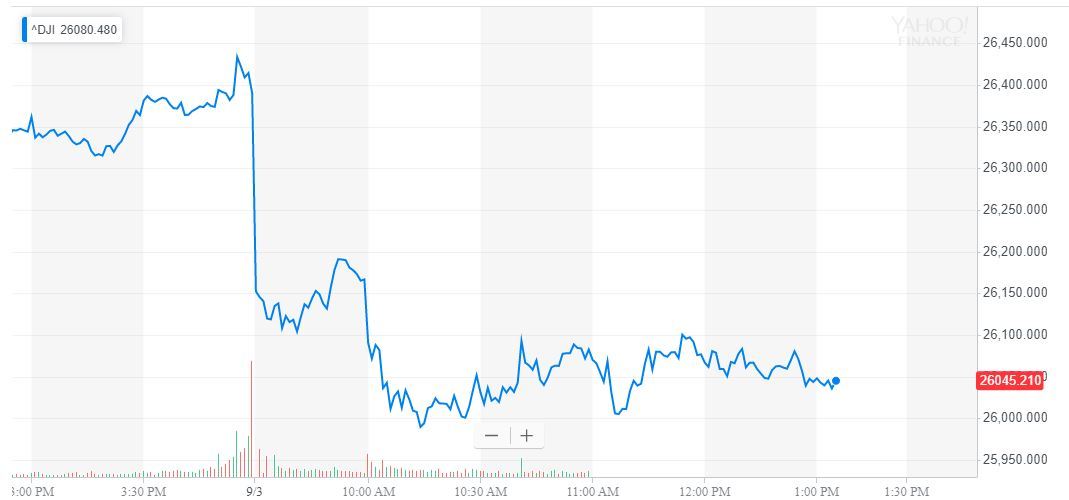
Dow Nosedives as Investors Brace for Market’s Worst Month of the Year

The Dow took a nosedive on Tuesday, as the trade war continued to escalate and the stock market braced for its worth month of the year. | Source: REUTERS/Brendan McDermid
The Dow stumbled into the first trading session of September after the United States and China failed to strike another tariff truce that would have prevented new import duties from going into effect.
As the trade war continues to escalate, the Dow now enters what has historically proven to be its worst month of the year.
Dow Stumbles Into September’s Opening Session
Wall Street’s three most closely-watched indices all took substantial losses on Tuesday. As of 1:18 pm ET, the Dow Jones Industrial Average had plunged by 347.27 points or 1.32% to 26,056.01.

Boeing, the Dow’s largest component, dropped 3.28%. Caterpillar, another DJIA stock heavily impacted by the trade war, declined 2.84%.
The S&P 500 slid 24.83 points or 0.85% to 2,901.62. Eight of 11 primary sectors reported declines, but utilities surged 1.3%.
The Nasdaq lost 92.42 points or 1.16%, reducing the tech-heavy index to 7,870.46.
September Brings Further Trade War Escalation
Stocks rallied to close out August, trading higher because President Trump seemed to have adopted a softer stance on China in response to market pressure.
However, the White House followed through on its controversial plan to increase import duties on September 1, even after Beijing reportedly proposed that the two economic superpowers delay those tariff hikes.
And that’s not the only indication that trade negotiations aren’t approaching a peaceful resolution.
While most of the US was enjoying the Labor Day holiday, Beijing filed a complaint against the White House at the World Trade Organization. China’s Commerce Ministry alleges that the Trump administration violated an agreement Trump made with Chinese President Xi Jinping at the recent G-20 summit in Osaka.
According to Bloomberg , US and Chinese officials can’t even agree on the “basic terms” of their planned meeting this month, which is supposed to take place in Washington.
Dow Braces for Worst Month of the Year
This, coupled with numerous recession indicators, places the Dow on shaky footing heading into September.
September isn’t just the worst month of the year for stocks – it’s also the only month when the Dow has averaged declines over the past century.
During the last 20 years, the DJIA has declined in September 55% of the time, for an average pullback of 1.18%.
Click here for a real-time Dow Jones Industrial Average chart.