

The relatively slight downward pressure in Bitcoin the last few days strikes me as portending a likely fall in the next week or two. Likely to the area of the support found at ~ 541 a number of weeks ago.
I say this because as you can see, price has broken below the 1.618 extension of the pitchfork, as seen above. And…

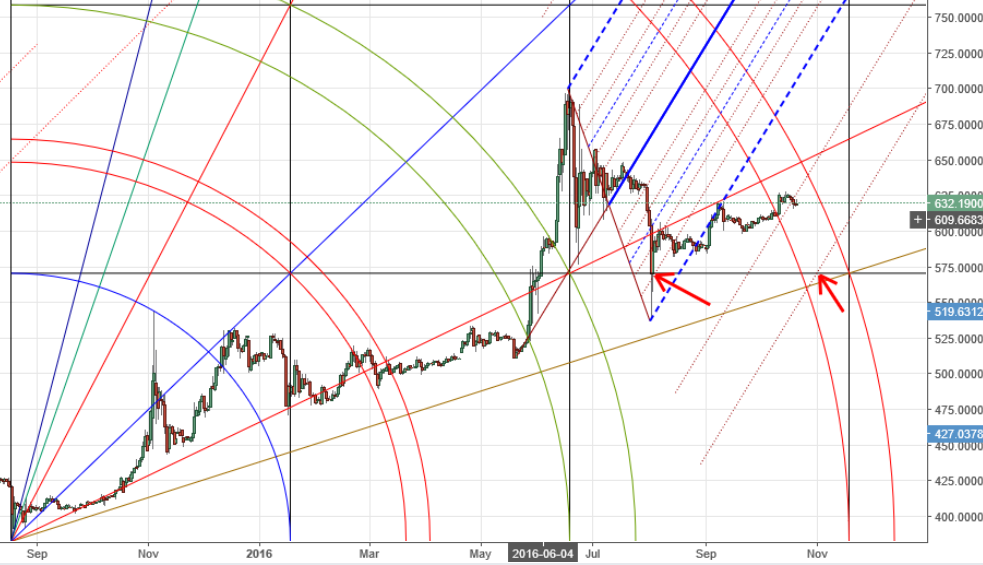
As you can see, it appears that resistance from the Gann 2×1 angle is stronger than the arc support at this point in time. The 2×1 has not been broken but 4th arc support has been broken. If – as seems likely – price breaks below the 4th arc pair in the next day or two, then the 5th arc pair is the next target to the downside. Note that the 2.236 (square root of 5) extension of the pitchfork intersects almost exactly with the 5th arc. So there is double support there.
If we view both those setups at the same time, the picture can get a bit confusing. But if you refer to the first chart above and the second, you can get a sense for the two are acting together. This is a reasonable thing to do, as bulls and bears both exist in the market at the same time, most of the time.
 I know this is a confusing picture, but after you have looked at the Gann Square long enough, you can see beyond the confusion, and see which arc and angle belongs to which setup. The point is that as long price is within the 3rd arc pair of the bull setup (1st picture above), ANYTHING can happen. As discussed above, It is quite reasonable to imagine that price will head to the 5th arc of the bear setup after it gets through the 4th arc pair (green arcs). It can do all this while still in the 3rd arc of the bull setup.
Can you see it?
Also, for Elliott Wave fans out there, this move up from the August low is NOT looking like an impulse wave. It is almost certainly corrective, suggesting this might be the tail end of a “B wave” (A-B-C). A “C wave” down might be on the immediate horizon.
This all makes sense as a reasonable possibility, given what we are seeing here on these 2 setups. So stay sharp…
Happy trading!
Remember: The author is a trader who is subject to all manner of error in judgement. Do your own research, and be prepared to take full responsibility for your own trades.
Image from Shutterstock.
